Monthly News Summary – May 2010
- NOAA/CIMSS Team Uses Satellite Data to Track Volcanic Ash
- GOES-15 Takes First Image
- GOES-12 Replaced By GOES-13
- WGN-TV Report Highlights CIMSS
- Meteor Burst Captured by AOSS Camera
- “Science Expeditions” Explores AOSS
- SSEC Student Presents at Undergraduate Symposium
- Publications
NOAA/CIMSS Team Uses Satellite Data to Track Volcanic Ash
Mike Pavolonis, a National Oceanic and Atmospheric Administration (NOAA) researcher working at the UW-Madison Cooperative Institute of Meteorological Satellite Studies (CIMSS), has created a unique set of mathematical equations to plot and analyze atmospheric ash clouds from volcanic eruptions. (UW-Madison press release)
Pavolinis’ next generation Geostationary Operational Environmental Satellite (GOES)-R volcanic ash detection and property retrieval algorithm was applied to Spinning Enhanced Visible/Infrared Imager (SEVIRI) imagery of the recent Eyjafjallajökull eruption and ash cloud to create products used by, among others, the London Volcanic Ash Advisory Center (VAAC).
These products extracted vital information about the dangerous ash clouds from geostationary satellite data, providing critical information on ash cloud height, mass loading, and particle size of the Iceland eruption.
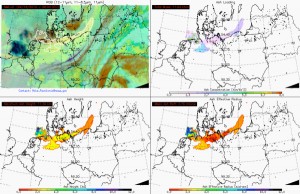
Results from the automated next generation Geostationary Operational Environmental Satellite (GOES-R) volcanic ash detection and retrieval system are shown for ash clouds produced by eruptions of Eyjafjallajökull, Iceland on 15 April 2010. A false color image is shown in the upper left panel, the ash mass loading in the upper right panel, the ash cloud height in the lower left panel, and the ash cloud effective particle radius in the lower right panel. The outline of the ash clouds detected by the automated algorithm is contoured in white on the false color images. These images show the ash cloud over Germany, the Czech Republic, and Poland on 16 April 2010 at 18:30 UTC.
Based on this information air traffic control organizations diverted and grounded over 4000 flights in northern Europe.
“Our eventual goal,” Pavolonis says, “is a fully automated global ash monitoring system. Satellites will supply data that will be processed and all of it will be operational. Every volcano will be automatically monitored. Satellite data will be used in models to predict where the ash will go.”
The GOES-R products and additional satellite imagery were posted to the Cooperative Institute for Meteorological Studies (CIMSS) Satellite Blog.
The SEVIRI products are also available online.
Pavolonis has assembled a ~6 day SEVIRI movie (hourly time intervals) showing the numerous eruptions of Eyjafjallajökull. There are a few frames in which ash is not visible due to meteorological clouds, but most frames have detectable ash clouds. The movie can be downloaded as a Quicktime movie (14M) or an AVI (169M).
An animated data stream created by the Pavolonis algorithm.
Pavolonis currently serves as a member of the NOAA Eyjafjallajökull Volcanic Ash Response Working Group and the NOAA Volcanic Ash Science Team.
In addition, he attended the 5th International Workshop on Volcanic Ash in Santiago, Chile, 22-26 March 2010. The goals of the workshop, which was convened by the World Meteorological Organization (WMO) in collaboration with the International Civil Aviation Organization (ICAO), were to highlight scientific progress in characterizing volcanic ash hazards to aviation and apply research results to the practical issue of ash avoidance.
Pavolonis gave an invited presentation entitled “Advances in Automated Satellite Remote Sensing of Volcanic Ash” and served on the “Detection and Tracking of Volcanic Ash & Gas Clouds” discussion panel.
More excellent photos of the eruption.
Elsewhere on the ever-helpful Web, a pronunciation guide.
The first Geostationary Operational Environmental Satellite (GOES)-15 Imager full-disk visible image was received on 6 April 2010 starting at 1733 UTC.
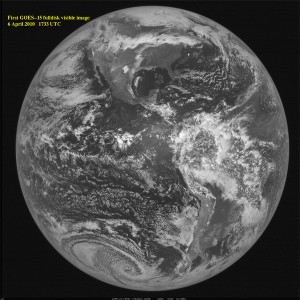
This image was ingested by the Space Science and Engineering Center’s (SSEC) Data Center and displayed in realtime. The Cooperative Institute for Meteorological Satellite Studies (CIMSS) Satellite Blog posted several high spatial resolution images. A large full disk image created by ASPB (Advanced Satellite Products Branch) was used in both the NOAA and NASA GOES-15 press releases.
The first GOES-15 Sounder visible image was scanned on 8 April 2010. Also see the NOAA Science Test page.
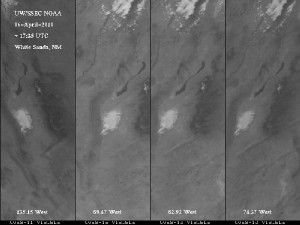
The view of White Sands, NM, from four GOES Imagers in the visible spectral region on 6 April 2010. The four GOES sub-point longitudes are noted on each panel.
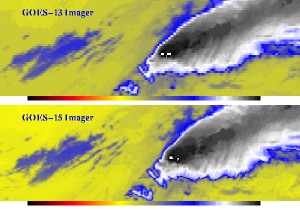
Image showing the improved 13.3 um band spatial resolution.
Other images:
At 1834 UTC on 14 April 2010, the Geostationary Operational Environmental Satellite (GOES)-12 was replaced with GOES-13 as the U.S. operational eastern geostationary satellite.
Launched 24 May 2006, GOES-13 was the first in the series of GOES-N satellites (Subsequent satellites in the series are GOES-14, which was launched 27 June 2009, and GOES-15, launched 4 March 2010). GOES-13 carries the same imager and sounder payload as GOES-12, but the new spacecraft bus will allow it to operate when in the Earth’s shadow and images will have increased navigation, registration and radiometric accuracy.
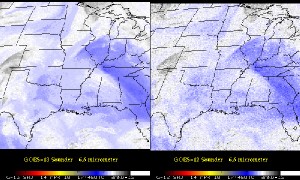
GOES-13 and GOES-12 Sounder Band 12 (6.5 micrometer) bands starting at 17:46 UTC on 14 April 2010. This is the “last” GOES-12 operational image from the Sounder. Note the much improved signal-to-noise ratio of GOES-13.
Scientists from the Cooperative Institute for Meteorological Satellite Studies (CIMSS) and Advanced Satellite Products Branch (ASPB) have been instrumental in supporting GOES-13 from before the GOES-13 Science Test (December 2006) through the just-completed pre-operational transitional phase.
After GOES-13 becomes the operational GOES-East satellite, GOES-12 will be moved to 60W longitude to support GOES-South America.
WGN-TV Report Highlights CIMSS
On 26 March 2010 Tom Skilling, popular veteran meteorologist of WGN-TV (Chicago, IL), visited the Cooperative Institute for Meteorological Satellite Studies (CIMSS), shooting footage and interviewing scientists for a 6-minute program aired on 12 April 2010. The special, “A Revolution in Forecasting,” illustrated improvements in observations, models and technology that forecast, identify and track severe weather events.
Several CIMSS scientists briefed Mr. Skilling on the many aspects of CIMSS research at the UW-Madison:
Data Center – Tom Achtor
McIDAS – Jessica Staude
Tropical Cyclones – Chris Velden and Tim Olander
Convective Initiation – Justin Sieglaff
Moderate Resolution Imaging Spectroradiometer (MODIS) Lake Michigan products – Jordan Gerth;
Geostationary Operational Environmental Satellite (GOES)-R – Tim Schmit.
Mr. Skilling also interviewed CIMSS Director Steve Ackerman on the role of cooperative institutes in research to operations.
Meteor Burst Captured by AOSS Camera
The AOSS Building Roof Camera system caught a flaming meteor as it burned across the Midwestern sky just after 10 pm 14 April 2010. Flying in over southern Minnesota, across Southern Wisconsin and on over Northern Illinois, the fireball was seen across several states. At one point in its flight over Western Wisconsin, it suddenly burst into a bright fireball, filling the sky with light.
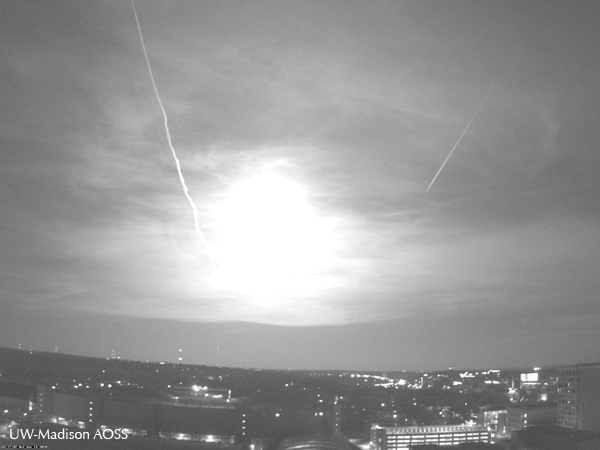
View of the meteor burst from the AOSS Building looking directly west over Camp Randall Stadium.
The frame above is part of a short video clip (FLASH / GIF) captured by the AOSS webcam on the roof. The roof camera makes one exposure every ten seconds. An airplane can be seen headed west and then the glowing object appears. Ten seconds later, in the next frame, the meteor is caught perfectly in mid-burst, highlighting two con trails with its glow.
The GOES-11 satellite detected the meteor’s trail.
A Howard County, Iowa, Sheriff recorded the meteor with his dashboard camera. After the dramatic burst the object flies on into the Eastern sky.
The NWS in LaCrosse registered what is presumed to be the trail of the meteor with their radar.
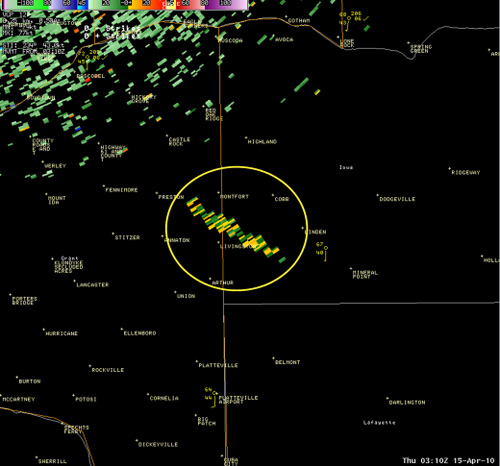
0.9 degree reflectivity from 1010 pm off of the NWS La Crosse radar at about 10,000 feet above ground level.
And the NWS in Davenport, Iowa, also registered what could be the trail.
The footage taken with our roof cam was broadcast on numerous television reports, including CNN and Fox News, and used by dozens of online news organizations.
Pieces of the meteor have been retrieved from southwest Wisconsin and were briefly displayed at the UW-Madison Department of Geoscience.
“Science Expeditions” Explores AOSS
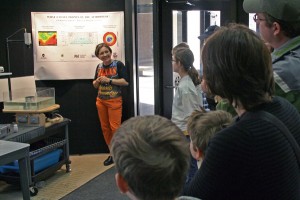
On Saturday, 10 April 2010, the UW-Madison hosted Science Expeditions, an exciting day of hands-on Exploration Stations and intriguing science spectaculars for both parents and children presented by various science and technology venues on campus.
Between 100 – 200 science adventurers visited the AOSS building to learn about climate studies at the UW and examine different applications of remote sensing technology.
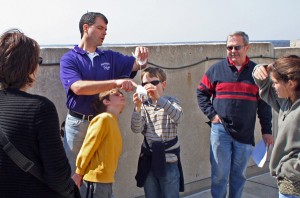
Tom Whittaker helped kids “Explore the Atmosphere” with a set of computer applets that teach the basics of atmospheric science.
Galen McKinley, from the Department of Atmospheric and Oceanic Sciences, used a rotating tank experiment to illustrate principles of meteorology, oceanography and climate fluid dynamics.
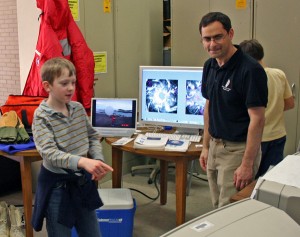
Matthew Lazzara and George Weidner (ably assisted by Noah, the trusty Polar Guide) took visitors on a quick tour of Antarctica.
Rick Kohrs and Margaret Mooney ran the 3-D Globe, demonstrating satellite technology and orbital paths, weather patterns, sea surface temperatures and hurricane tracking, as well as a brief tour of the Solar System.
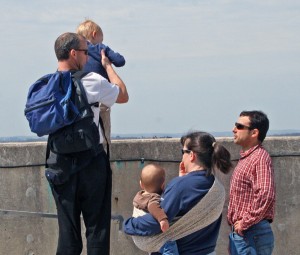
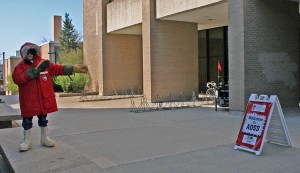
Dave Turner and Bob Holz greeted visitors on the roof, providing insightful answers to questions, while Erin Wagner, Eric Thompson and Mark Hobson hosted tours for up-close looks at the antenna array and great panoramas of Madison.
Science Olympiad Crowds the Halls
Making the day even more exciting was the presence of the Wisconsin Science Olympiad.
Hosted this year by the UW-Madison College of Engineering, the 2010 competition brought hundreds of students from around the state to compete for points in a series of individual and team events in the disciplines of biology, earth science, chemistry, physics, and technology.
90 separate teams of several students each were assigned a section of a corridor in the AOSS Building as a “home base” from which they would sally forth to different campus venues.
The elevators strained under the constant load of enthusiastic participants from both events, the noise levels occasionally rose above optimum, but all went reasonably well and a shared passion for science carried the day.
SSEC Student Presents at Undergraduate Symposium
Emily Sorensen, a student hourly for Dave Santek, gave a presentation at the Undergraduate Symposium
on 15 April 2010. This annual event, held at the Memorial Union, consisted of oral presentations and posters from more than 500 undergraduate students across all departments on campus. Emily gave a talk entitled “Why is that crater moving? Measuring errors in Mars satellite images due to camera lens distortion.”
Paper Published on MODIS Arctic Cloud Detection and Trend Analysis: A paper titled “Errors in cloud detection over the Arctic using a satellite imager and implications for observing feedback mechanisms” was published in the Journal of Climate (Vol. 23, No. 7, 1894–1907). The authors are Yinghui Liu (Cooperative Institute for Meteorological Satellite Studies, CIMSS), Steven A. Ackerman (CIMSS), Brent C. Maddux (CIMSS), Jeffrey R. Key (NESDIS/STAR), and Richard A. Frey (CIMSS). The article evaluates the Moderate Resolution Imaging Spectroradiometer (MODIS) cloud detection performance with changing surface conditions in the Arctic and identifies its implications for climate studies.
Manuscript on Infrared Radiance Assimilation Accepted for Publication: A manuscript entitled “Clear and Cloudy Sky Infrared Brightness Temperature Assimilation Using an Ensemble Kalman Filter” was accepted for publication in the Journal of Geophysical Research. The paper by Jason Otkin (Cooperative Institute for Meteorological Satellite Studies, CIMSS) presents results from a regional-scale Observation System Simulation Experiment (OSSE) that examined how the assimilation of 8.5 μm brightness temperatures for both clear and cloudy-sky conditions impacts the accuracy of atmospheric analyses when using an Ensemble Kalman Filter data assimilation system.