Monthly News Summary – December 2001
On and In The Ice
by Terri Gregory, SSEC Public Information Coordinator
December 2001
This issue of In the News covers November 2001 and includes news not covered in previous issues. Use images freely with credit to the Space Science and Engineering Center, University of Wisconsin–Madison. We’d appreciate a copy or notice when you use something.
Weather data—The weather on and around Antarctica, known to its researchers as “the Ice,” is harder to forecast than practically anywhere else in the world. Knowing when the continent’s fierce winds will rise up or when clouds will blanket it is crucial for pilots bringing in researchers and supplies, by plane or by icebreaker. Data collected by Automatic Weather Stations enable forecasters to know what ground conditions are like. The stations are installed and maintained by UW–Madison researchers directed by pioneering polar meteorologist Charles Stearns. University Communications’ Emily Carlson features the group in her article inWisconsin Week, November 28. Besides forecasting current weather, AWS data have been used in numerical models and is freely available to scientists around the world.
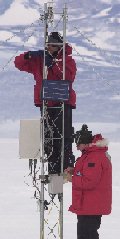 |
Jonathan Thom (top, SSEC) and Rob Flint (SSEC contractor) refurbish an Automatic Weather Station called Pegasus North, about 17-20 miles from McMurdo Station in Antarctica. The mountain in the background is Mt. Aurora on Black Island. (Photo courtesy of Ernest Mastroianni, Milwaukee Journal-Sentinel) |
National Geographic magazine and Web site present major coverage of Antarctica in December. “Frozen Under” covers life and research on the continent, “Islands of Ice”covers a visit to Iceberg B-15. The online version of “Frozen” offers video of the reporter’s visit and interviews. It provides a good introduction to Antarctica. The section “Human Footprints” shows that the continent is, since people have inhabited it, no longer pristine. Online and print versions of this National Geographicissue differ. You’ll want to experience both.
B-15—The December National Geographic “Islands of Ice” interactive feature includes a long article; a map showing iceberg motion, to which Matthew Lazzara (Antarctic Meteorological Research Center co-investigator) contributed; photographs; personal accounts of National Geographic’s visit to the iceberg; video; and links to Web sites, including the AMRC’s iceberg pages. A blemish on this exciting display is an error in one video segment. The video’s narration, made by contractors to NG, errs in saying that sea levels will rise when the iceberg melts. This is not true. For example, when an ice cube melts in a glass of water, the water does not rise. According to Lazzara, “The floating ice displaces the same volume of water it would if were indeed melted into water. Since the icebergs calved from the floating Ross Ice Shelf, they will have no effect on sea level.” The National Geographichas said that they regret the error.
The AMANDA neutrino telescope is mentioned in the print version of National Geographic as one of several unique telescopes in Antarctica. The Antarctic Muon and Neutrino Detector Array is a telescope that is “aimed into the ice” so that Earth acts as a filter for particles coming from space through Earth’s northern hemisphere. Darryn Schneider, UW–Madison’s Department of Physics, explained that neutrinos are tracked when particles (muons) interact with the ice. Schneider said, “The ice is pure and transparent, allowing us to see the muon’s glow,” and illuminating the neutrino’s path through the ice. SSEC administers AMANDA through the Antarctic Astronomy and Astrophysics Research Institute, which will also house IceCube, a greatly expanded neutrino telescope.
IceCube received congressional committee approval, as noted in UW–Madison’s campus newspaper, Wisconsin Week (November 28). University Communications used an easily comprehensible graphic to explain the project, which involves sinking into the south polar ice an array of detectors (photomultiplier tubes) that act as lightbulbs in reverse. The $15 million grant was included in the fiscal year 2002 budget bill for Veterans Administration, Housing and Urban Development and National Science Foundation. UW–Madison is lead institution for 20 collaborating groups from around the world.
Views from Space
For more information
Via MODIS—When Hurricane Michelle moved through the Caribbean in early November, it naturally stirred up the water. Its effect is particularly dramatic on shallow water around the Bahamas. Turbidity caused by the hurricane’s passage is seen in this MODIS image from November 6 acquired by direct broadcast at SSEC.
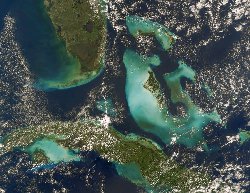 |
The MODIS image from November 6 (top) shows high levels of turbidity in the Bahama Banks region following the passage of Hurricane Michelle. This true color image is paired with one from October 5 (bottom) showing the normal clarity of the waters. Images were remapped to Lambert Equal Area projection at 250 meter grid resolution using a combination of in-house IDL software and the NSIDC “mapx” toolkit. Click on the small images for the full resolution version. (Liam Gumley) |
The National Hurricane Center will use a high-resolution MODIS image of Hurricane Erin taken 1530 UTC on September 9 in their Tropical Cyclone Report, written by hurricane specialist Richard Pasch.
Iceberg—The Antarctic Meteorological Research Center provided a recent image of mammoth iceberg B-15 to Raytheon Polar Services. Public Relations director Elaine Hood used it for a presentation to the Denver Museum as background for an IMAX movie on the Shackleton expedition to Antarctica. Raytheon provides most logistical support for researchers in Antarctica and wanted to encourage people to learn more about the continent.
Finding bin Laden—Madison’s Capital Times reporter Aaron Nathans and WKOW-TV anchor Monique Laven interviewed several UW-Madison researchers for a joint Q&A project. Viewers and readers asked, “Why can’t the U.S. military use satellite technology to track down … bin Laden … ?” In early November, Tom Achtor, SSEC’s executive director for science, provided Laven with a general explanation of satellite technology, pointing out that the satellites from which SSEC gathers data would not be used in warfare—the resolution would not be high enough. On her TV broadcast, Laven interviewed Tom Lillesand, director of UW–Madison’s Environmental Remote Sensing Center. That center works with higher resolution data from sources such as Landsat and aerial photography. Lillesand provided more detail, and Laven used props to show how the mouths of caves could be tilted away from view. The Capital Times provided a different perspective on November 8. SSEC’s Tom Whittaker noted that a satellite’s “top-of-head” view would not give facial details. Department of Astronomy’s Jeff Percival noted, as had Achtor, that it is impossible for satellites to cut through caves to see inside.
Aurora—In early November, a blazing aurora borealis spread across the northern sky, dipping as far south as southern Wisconsin. SSEC was pleased to help the Air Force weather program circulate an image from the Defense Meteorological Program satellite, the only weather satellite that can “see” night lighting, lightning, and the aurora. John Zapotocny, a civilian meteorologist working for the Air Force and a UW–Madison graduate, graciously shared the imagery, produced by Mark Conner, a contractor supporting the Satellite Application Branch. Zapotocny noted,“It’s very rare to have aurora of this intensity extending to such a low latitude.” The images were taken by the DMSP F15 satellite on the night of November 5 at about 0245 UTC. NASA’s EOS science writing team at Goddard Space Flight Center forwarded the images to the Weather Channel. From the 1970s until 1983, SSEC was home to the DMSP archive of film strip data, which now resides at NOAA’s National Geophysical Data Center in Boulder, CO.
 |
This DMSP image taken on November 5 shows the extent of the aurora borealis. The white “blobs” are city lights. |
Twin Towers—Grant Linton, a television broadcasting student at Loyalist College in Belleville, Ontario, Canada will use satellite images of Manhattan’s World Trade Center attack in a documentary recounting reaction to the tragedy of September 11th. The project will be aired on Belleville’s cable stations.
Weather Research
Burning—Results from the Geostationary Operational Environmental Satellite (GOES)-8 Automated Biomass Burning Algorithm (ABBA) for the 1998 fire season in South America are published in the journal, Forest Ecology and Management. The article, “Road paving, fire regime feedbacks, and the future of the Amazon forests,” released in December, discusses the role of fire in the Amazon forests and the positive feedback loops that contribute to the negative impact of fire throughout the region. Authors are D. Nepstad (Woods Hole Research Center) and a host of others from the United States, Brazil, and Great Britain, including Elaine Prins (NOAA, stationed at SSEC). Joleen Feltz (SSEC) contributed to the research.
 |
Panel A shows flammable forests, deforested land and roads in the Brazilian Amazon region. Panel B depicts flammable forests and fires detected with the GOES-8 ABBA during 1998. Most flammable forests are currently protected from fire because they are far from ignition sources (panel B). However, highway paving proposed by the Brazilian government would stimulate colonization in this fire-vulnerable region, nearly doubling the amount of forested land that is within the agricultural frontier. Paved roads and roads to be paved through the Avança Brasil program are shown as 100 km wide corridors centered on the roads (locations A-G). The deforestation map is based on Landsat Thematic Mapper scenes (1991/1992) obtained from Michigan State University. |
As part of an ongoing real-time data assimilation effort with the Naval Research Laboratory (NRL) in Monterey, CA, wildfire satellite products are being assimilated every half hour into the Navy Aerosol Analysis and Prediction System to analyze and predict the smoke’s location and amount, and where the winds are blowing it. For a week in mid-November, the GOES-8 Wildfire Automated Biomass Burning Algorithm (ABBA) detected enhanced fire activity in the southeastern U.S. Wildfires were observed in Tennessee, North Carolina, Kentucky, West Virginia, and Virginia. For that week, the Navy computer model successfully documented the transport of smoke associated with these wildfires.
This animation of the GOES-8 Wildfire ABBA product shows agricultural burning and wildfires from 12:15 to 23:45 UTC on November 14, 2001. Processed fire pixels are identified in red, saturated fire pixels are yellow, and cloud-contaminated fire pixels are in magenta. Fire pixels are labeled in orange for the high possibility of a fire, navy for medium possibility, and light blue for low. (C.Schmidt, E.Prins)
The polar wind—According to N. Bormann of the European Centre for Medium Range Weather Forecasting, the ECMWF is “quite happy with the results” of their initial evaluation of a 10-day data set of polar region winds derived from MODerate-resolution Imaging Spectroradiometer measurements. The ECMWF, located in Reading, England, is also “rather impressed about the quality of the winds,” developed by Jeff Key (team leader, NOAA group at SSEC), and Chris Velden and Dave Santek (SSEC/CIMSS).
More GOES-12 test results—Scientists have found that imaging instruments on GOES-10 and GOES-12 agree, when their brightness temperatures are compared. Mat Gunshor (SSEC/CIMSS) compared the imagers at the mid-point between satellites (0N, 112.5W) on November 6, 2001 at 0900 UTC when the two satellites shared the same schedule. He found good agreement in bands 2 (4 microns), 3 (6.7/6.5 microns), and 4 (11 microns) when spectral responses are taken into account. The comparison was made by calculating the brightness temperature for each of the bands on both instruments with a radiative transfer model under the same conditions, then subtracting them from the averaged measured brightness temperatures for a tropical location. Brightness temperature differences (GOES-12 minus GOES-10) were very small: -0.4 K, 0.1 K, and -0.2 K in bands 2, 3, and 4 respectively, good news for scientists who want instruments that are measuring the same thing to agree.
Scott Bachmeier (SSEC/CIMSS) showed the improved spatial resolution of water vapor imagery from GOES-12 by comparing it with imagery from GOES-10 and GOES-8. The GOES-12 water vapor band can detect features as small as 4 km; GOES-8 and 11 have 8 km detectors. Image differences are also due to where the satellite is stationed above the equator (viewing geometry) and what layer it tends to look in the atmosphere (weighting function). However, water vapor boundaries appear smoother on GOES-12 and small-scale features such as mountain waves are better resolved. This will improve meteorological analyses of these features and will result in better feature tracking for retrievals of wind measurements.
Jolene Feltz and Elaine Prins compared brightness temperatures (GOES-12 3.9 micron channel) of active fires with those observed with GOES-8 in Brazil and GOES-10 in California. GOES-12 has a similar saturation temperature (~336 K) to both GOES-8 and GOES-11, but saturates at a much higher temperature than does GOES-10 (~321.5 K). It seems that GOES-12 will perform as well as GOES-8 and much better than GOES-10 in both fire detection and characterization.
GOES-9 testing—NOAA’s National Environmental Satellite, Data, and Information Service asked SSEC’s Data Center to process images from the GOES-9 imager and sounder instruments (one image for each instrument) when this satellite recently came out of storage. Data sets were made available via SSEC’s Man computer Interactive Data Access System’s (McIDAS) Abstract Distributive Data Environment. The images showed that visible data have high frequency noise, although this can be minimized by smoothing the data. As was seen before GOES-9 was put into storage, sounder data show temperature oscillations in the longest wave channels.
Broadcast
Weather Guys—Steve Ackerman and Jonathan Martin appeared on Wisconsin Public Radio on November 26. Steve Ackerman explained the varying colors in sun rises and sun sets. The show quickly focused on the validity of folk sayings, as Ackerman and Martin gave the scientific underpinnings of some. “Red sky in the morning, sailors take warning, …” works, meteorologically, as do those referring to mackerel skies. Storms generally do arise within 48 hours after a mackerel sky, as noted by an astute caller. Morning fogs can freeze dogs. The Guys appear next on December 31.
Tokyo-based Weathernews Inc., “the biggest weather forecast company in the world,” will use imagery from CIMSS’ Tropical Cyclones Web pages in their television broadcasts. According to meteorological consultant Masako Konishi, the Weathernews on TV has 2.4 million viewers. The Web site “is the biggest in Japan and has a million viewers per day.” Weathernews is networked around the world and the Chico, CA office uses McIDAS in their forecast operations.
In Print
Terra Cloud Mask—NASA’s Earth Observer newsletter (July/August 2001) covered the Terra Cloud Mask Workshop held in Madison in May. Paul Menzel (NOAA scientist stationed at SSEC) and Steve Ackerman (CIMSS director) reported that an international group of 55 scientists met to “discuss the status of the cloud detection for … [Terra satellite] instruments and to plan comparison studies.” Terra instrument scientists summarized modifications made to cloud detection algorithms after the satellite was launched and discussed possible future modifications. Focus groups addressed discussion points—a night-time (infrared) cloud mask, instrument performance issues, ancillary data, and validation efforts and comparison strategies. Meeting results and further discussions are being shared at instrument science team meetings.
The WIYN Observatory on Kitt Peak celebrated its fifth year of operations in October, as noted in Wisconsin Week (November 7). The modern telescope at the heart of the complex was designed and built and is owned and operated by a consortium made up of the National Optical Astronomy Observatories and several universities including UW–Madison. SSEC developed and installed the telescope’s control system which, in part, makes it capable of being remotely controlled. The telescope has “become recognized internationally for its superb image quality, its unique instrumental capabilities and its operational efficiency,” said UW–Madison professor Robert Mathieu, WIYN Board of Directors president.
McIDAS release—Tom Yoksas, of Unidata’s Program Center, enthusiastically reports (Unidata Newsletter, Summer/Fall 2001) that version 7.8 of McIDAS-X is ready for download. Yoksas focused on two new elements of this latest release of the venerable software system, used around the world to access and analyze weather satellite data. The McIDAS Graphical User Interface has been revised, and now “provides all the functionality found in the Function Key Menu interface it replaces.” Yoksas also mentioned a graphical interface to McIDAS startup that allows users to “specify a number of attributes of their sessions.” Unidata is funded by the National Science Foundation to enable “university researchers and educators to acquire and use atmospheric and related data.” SSEC’s McIDAS is one of two computer packages made available for this purpose.
Honors and Outreach
Speakers—Sanjay Limaye, SSEC scientist and director of the Office of Space Science Education, is among dozens of university employees recognized for speaking for UW–Madison’s Speakers’ Bureau. All 90 were listed in Wisconsin Week, October 10. Many other SSEC employees speak before groups, arranged through SSEC’sPublic Information Office.