Modeling in layers: Using remote sensing, GIS expertise to improve disaster responses
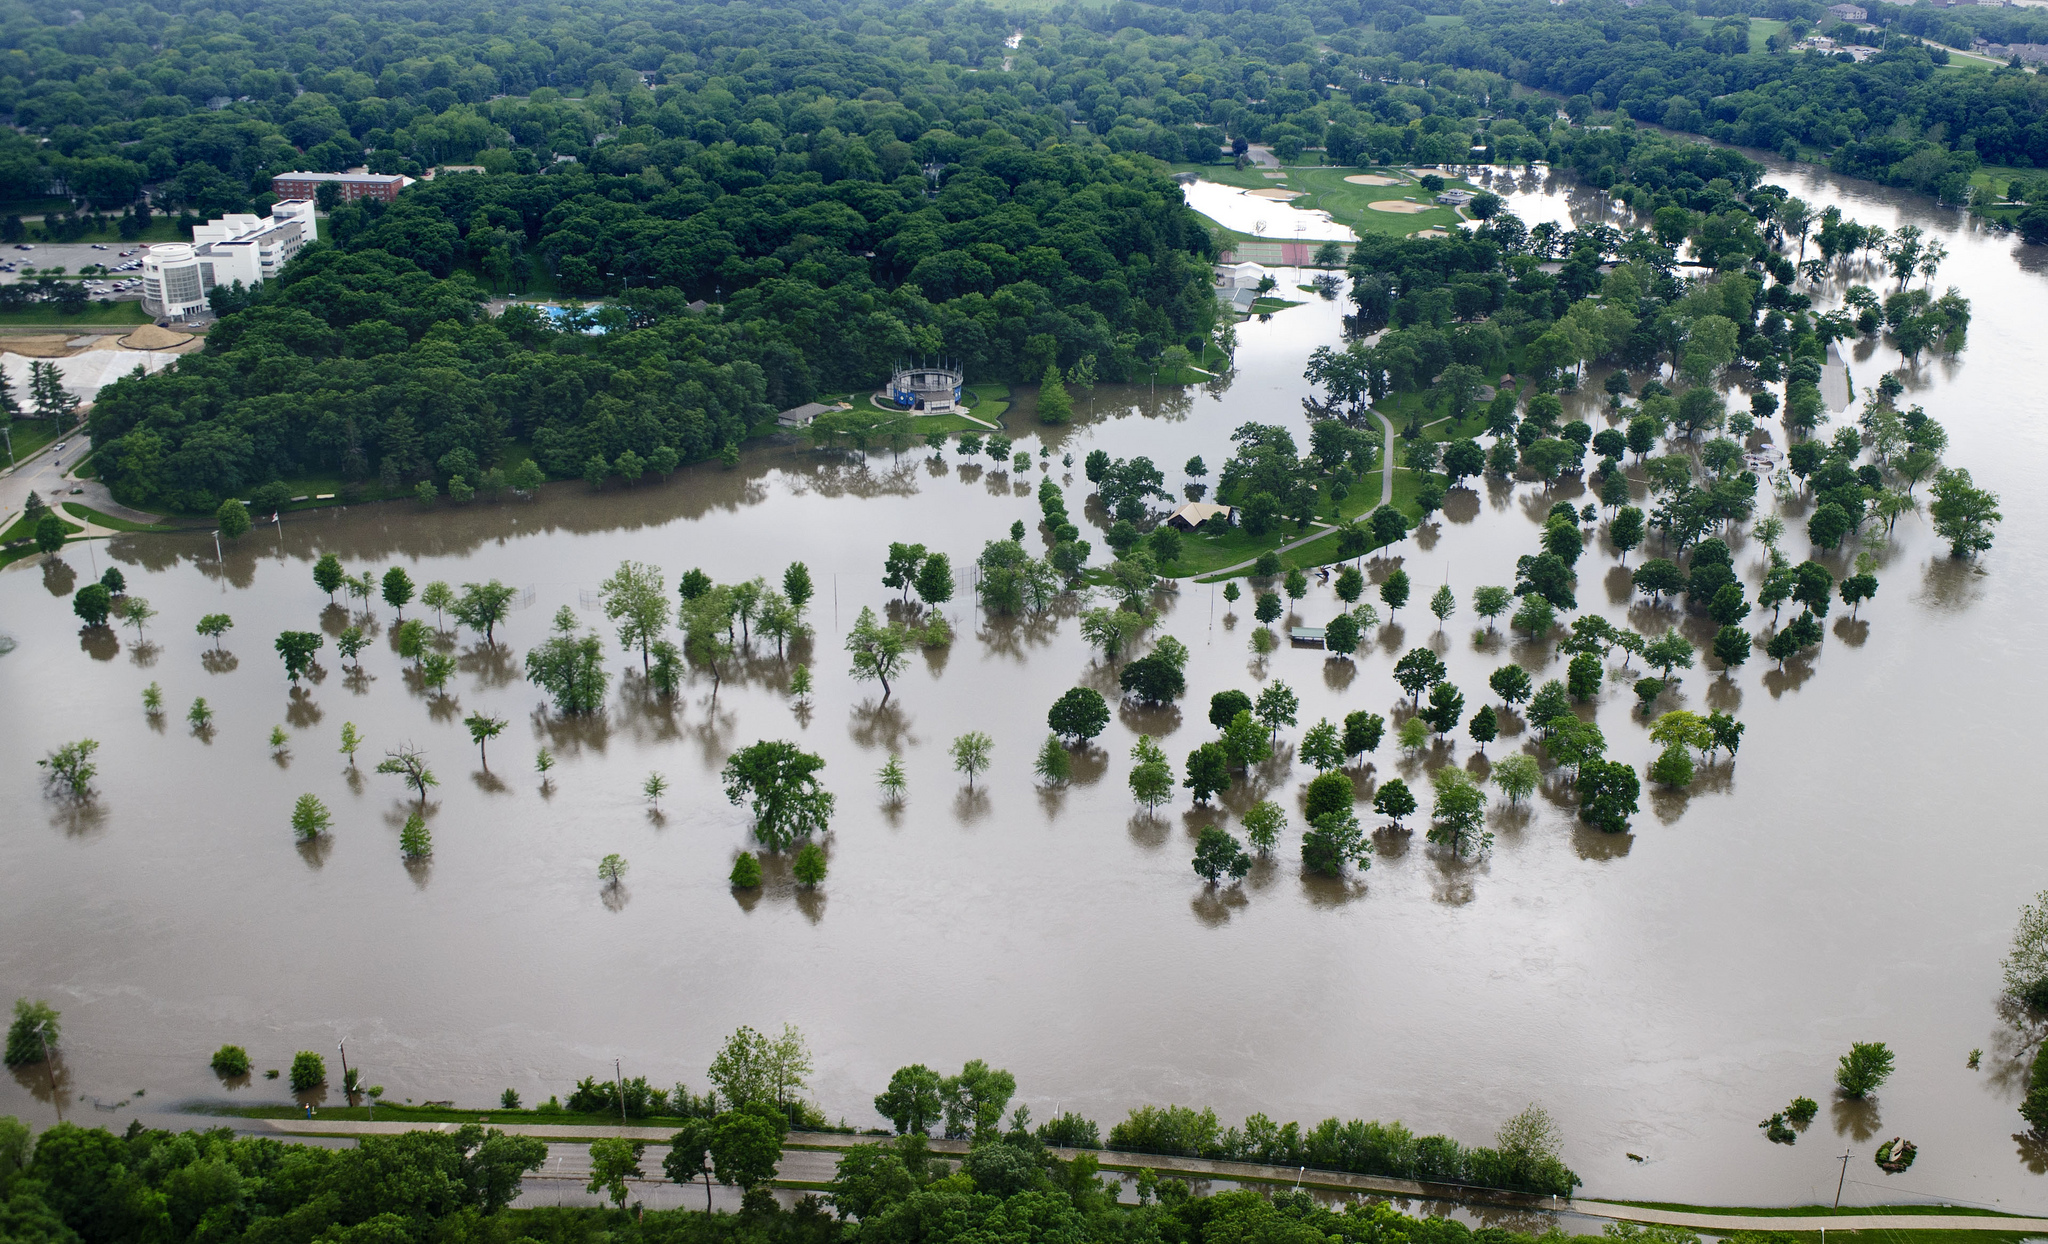
Severe flooding in Iowa in June 2013. Credit: Aneta Goska, Iowa Flood Center
Water is a vital resource, one that requires careful monitoring. Some areas do not have enough – California experienced a major drought in 2014 – while other areas receive too much – Buffalo, NY was blanketed by a major snowstorm in November 2014. The storm resulted in deaths and structural damage as roofs collapsed, followed by concerns about flooding as temperatures quickly rose in the days afterward.
Whether it is one extreme or the other, getting information about water issues to emergency managers and other decision makers is critical. What impact will the potential water shortage or flooding have on their community, and how significant will it be? What actions can they take to alleviate the problem?
Shane Hubbard of the Cooperative Institute for Meteorological Satellite Studies (CIMSS) has been working to better connect the institute’s remote sensing research and his own expertise in geographic information science (GIS) with groups interested in monitoring water issues, from local and state emergency management groups to the United States Geological Survey (USGS) and the Federal Emergency Management Agency (FEMA).
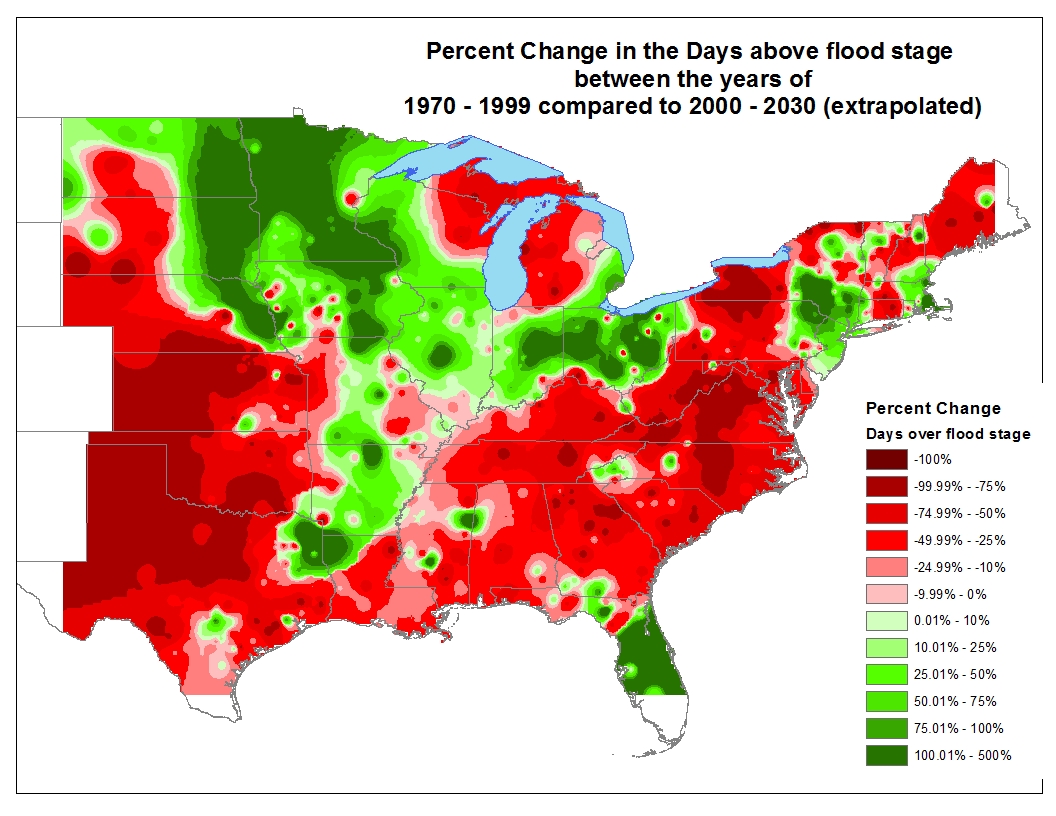
This figure represents the percentage change in the number of days over flood stage from two 30-year time periods (1970-1999 versus 2000-2029). Future values are extrapolated from the 2000-2014 trend. This analysis includes 800 U.S. Geological Survey streamgage locations. Areas in red depict the decrease in the average number of days above flood stage, while areas in green depict an average increase in the days above flood stage. Credit: USGS
While hired by CIMSS in 2013, Hubbard brings with him years of experience collaborating with these groups, particularly the USGS and FEMA. His work straddles the research and real worlds, as he looks not only to study ways to better predict hazards, but also to help emergency managers as they plan and manage their responses.
“I have a research side of my life and a support side of my life. I’m trying to do both, integrating my research into real-world applications,” he said.
Hubbard is working with the USGS on a number of different fronts, exploring ways to help them monitor water across the US. He noted their interest in using remote sensing to make observations of inland water temperatures, a significant input to their modeling work. The USGS could also use remote sensing data to better detect algal blooms, such as the one in Toledo this past summer.
“We’ve had a history of being able to do some identification and detection” of algal blooms, Hubbard said of the success of CIMSS and the Space Science and Engineering Center (SSEC) in this area.
Hubbard has also helped to connect other CIMSS scientists with the USGS. He mentioned using brownbag seminars at the USGS as a way to introduce their research – Christine Molling has presented on modeling agricultural runoff and Jason Otkin has presented on a flash drought index. Hubbard is hopeful these connections will lead to collaborative research.
Meanwhile, Hubbard is pursuing another, much larger-scale, collaboration with the USGS through the National Water Center (NWC), based at the University of Alabama. The NWC brings together a number of federal agencies, including the National Weather Service and the USGS, to examine all water issues, from shortages to excesses, around the country. He anticipates the opportunity to leverage SSEC resources to help the NWC with modeling.
“We have a variety of experts in the building that can provide assistance in many areas of the NWC’s mission: specifically, in the Data Center and supercomputing,” Hubbard said.
Add to that Hubbard’s experience with risk identification: experience that, in part, comes from years of working with state, local, and federal emergency management. Hubbard’s links to state emergency management (Wisconsin Emergency Management) date back to his time as a master’s student in the Department of Atmospheric and Oceanic Sciences at the University of Wisconsin-Madison when he worked as a hazard mitigation planner.
“I have been supporting emergency management ever since,” he said.
Since 2004 Hubbard has been involved with FEMA’s HAZUS-MH software program. He has served as a beta tester, collaborated on writing the course curriculum with Kevin Mickey of the Polis Center at Indiana University-Purdue University Indianapolis, and taught HAZUS-MH to others out in the field as well as at FEMA’s training facilities.
Hubbard described HAZUS-MH as a “damage and loss estimation software for hurricanes, floods, and earthquakes.” Users input information about people and buildings and select the hazard they wish to simulate. HAZUS-MH outputs the damages and losses based on the chosen scenario. That information can then be used to identify risks and create plans to mitigate them.
While HAZUS-MH was developed as a mitigation tool, Hubbard began using it as a prediction tool in 2008. In the presence of a flood forecast, he would use the software as much as 10 days out to develop damage and loss estimates.
“It really helps give perspective to emergency managers and decision makers. It helps you identify who needs to be evacuated, because you’re identifying the buildings that are in the floodplain. But it also gives a perspective on the magnitude of the event, the potential impacts of the event, and what the long-term recovery will look like.”
And the economic impact of lost businesses can be significant. Hubbard said that five or six businesses were unable to recover from the 2008 floods in Iowa City, IA while others that were eventually able to relocate took months to reopen.
Hubbard’s expertise has led him to work with Sandia National Labs. He helped them integrate HAZUS-MH into a tool they are developing for state and federal emergency management to run simulations. The simulations help managers to evaluate their preparations for various disaster scenarios.
Further, based on his experience with HAZUS-MH, Hubbard is working with CIMSS’ Tommy Jasmin to develop a tornado model. Similar to HAZUS, this model estimates damage and losses based on a tornado path provided by the user. Hubbard explained that this model has been used in national-level exercises in Washington, D.C.
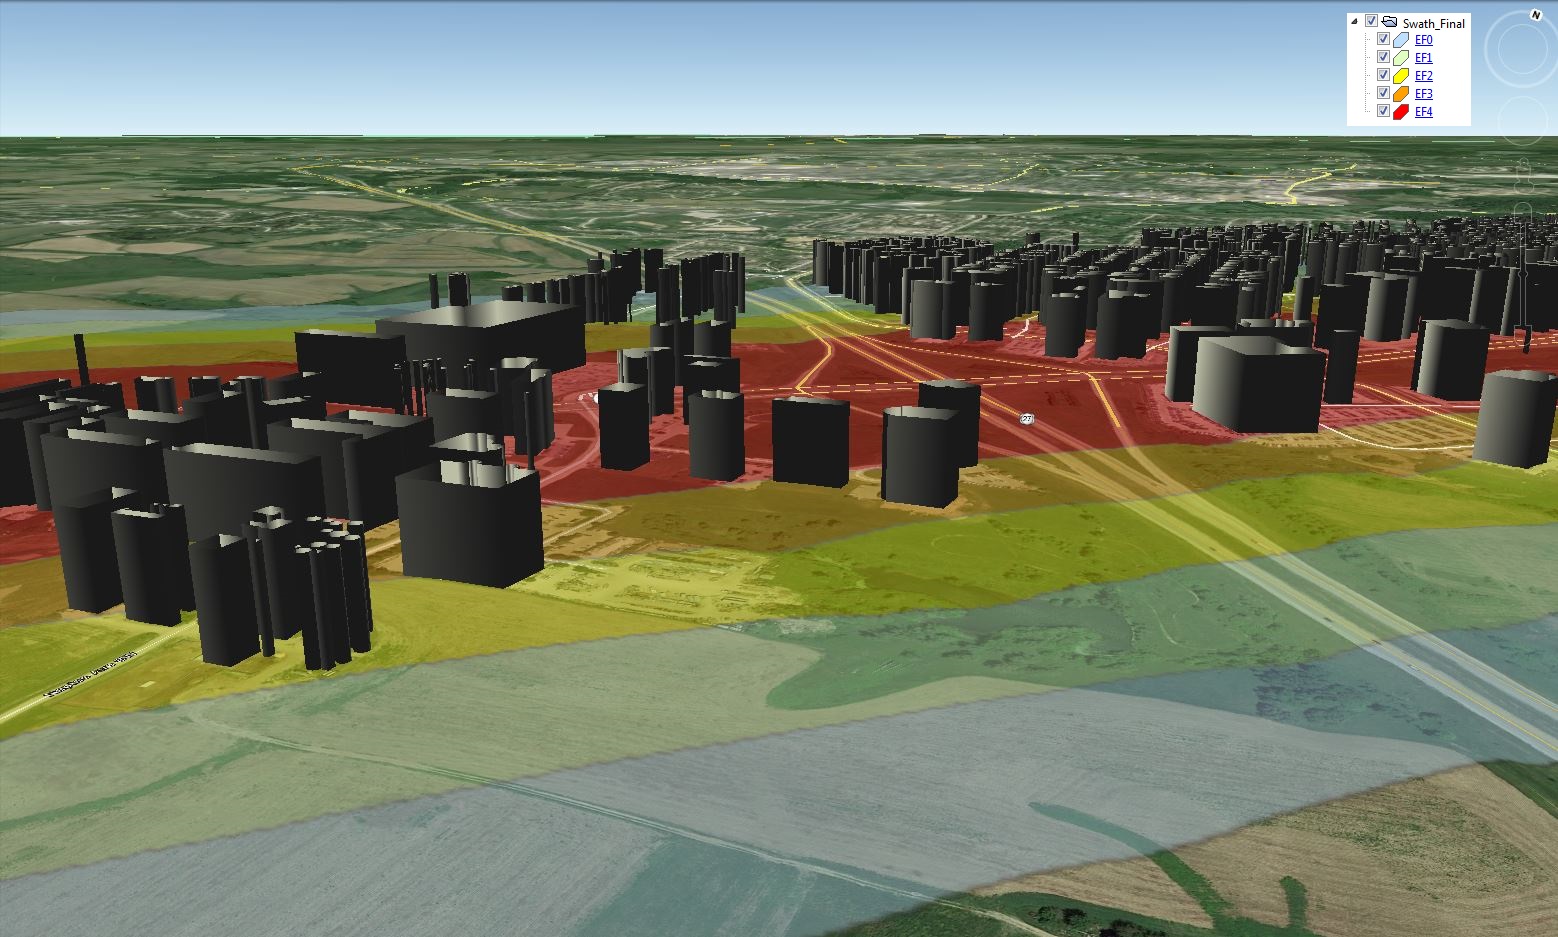
A screenshot from the spatiotemporal tornado-damage and loss-risk model that
Shane Hubbard and Tommy Jasmin are developing. Credit: Shane Hubbard, CIMSS
Closer to home, Hubbard has been meeting with Johnson County (Iowa) Emergency Management to discuss building a model similar to one he helped create when he was a Ph.D. student at the University of Iowa. At that time he was tasked with modeling how to evacuate building contents during a flood. Now Johnson County is focused on evacuating people – and not just who, but where and when.
As Hubbard explained, emergency management now wants to answer the question: “What’s the spatiotemporal evolution of future evacuations?”
Hubbard described the need for emergency managers to know whether, and when, to close roads and bridges, or to respond with floodgates, sandbags, and pumps. Numerous pieces need to come together at the right time to construct an effective response.
“[We are] trying to take the guesswork out of emergency response,” he said. “And where it’s not guesswork, where information is understood, [we are] trying to integrate this better into one place.”
While some of the collaborations Hubbard has fostered for CIMSS might be new, using GIS in the institute’s research is not as new as one might think.
“We’ve been doing GIS in this building, some of the same spatial concepts. It’s just not called GIS,” he said.
Layering brightness temperatures and doing comparisons is but one small example of these concepts at work, Hubbard noted, adding that GIS analysis methods, such as spatial autocorrelation, could prove useful as another way to examine remote sensing data.
In addition to creating external collaborations, Hubbard has been working on a number of internal projects. Mike Pavolonis, a member of the local National Oceanic and Atmospheric Administration’s Advanced Satellite Products Branch (NOAA ASPB), was eager to have Hubbard’s input on improving his fog detection algorithm, specifically with regard to valley fog. CIMSS’s Corey Calvert has been developing the algorithm, and the updated algorithm is “showing promise,” said Hubbard.
“It’s a really neat example of how my world and what we do in the Center, mostly atmospheric remote sensing, [intersect]. But there is really a connection between many of the things that can be going on in the atmosphere with things that are happening on the land. And we can use GIS to do some of that analysis,” Hubbard said.
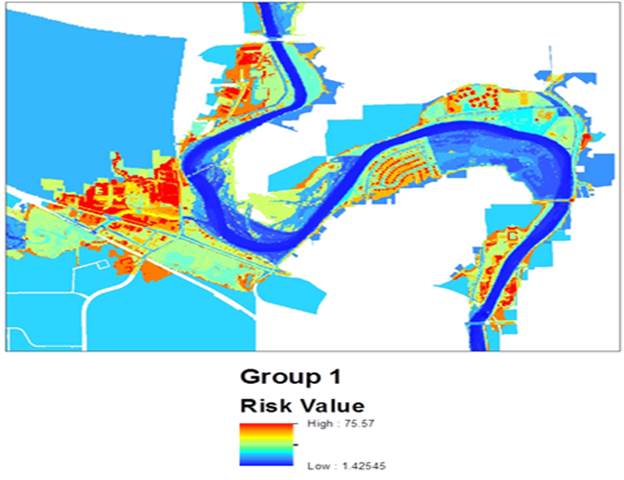
A geospatial representation of flood-response event risk based upon decision-makers’ priorities during flooding. Warmer colors represent higher risk values, and cooler colors represent lower risk values. Credit: Shane Hubbard, CIMSS
Looking back on his years of work, Hubbard noted that he has been involved in six flood responses, a tornado response, and two hurricane responses. Through those experiences, he has gained first-hand knowledge of the pressures facing emergency managers and their need for information.
“It’s funny… I started off in mitigation, and I’m getting further and further away from that,” he said. “There’s just been this real need for spatiotemporal information during a disaster response.
Hubbard’s response has been to dive into the work, creating successful collaborations that match the experts and data providers with the end users.
by Leanne Avila