Image 1: Globe Display
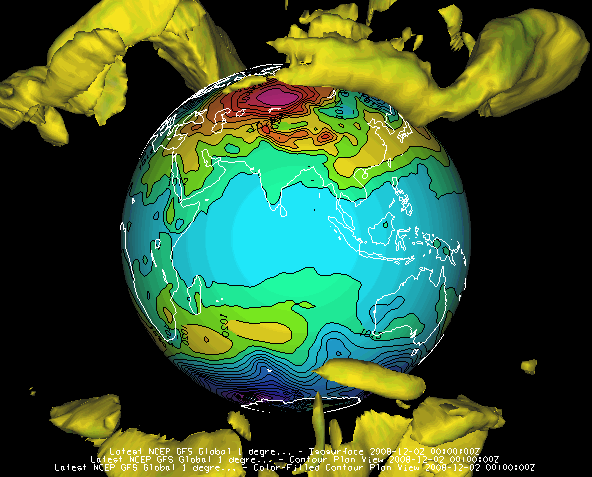
This section describes how to make a globe display. The illustration below shows a McIDAS-V Globe Display of GFS numerical weather prediction model output of mean sea level pressure (as color-shaded image and contour lines) and 50 m/s wind speed isosurfaces showing the jet streams.
In the Globe Display display of McIDAS-V, the displays and maps are projected onto a spherical globe. The globe can be rotated by hand or automatically, along with the usual zooming and time animation of displays on the globe.
To create a Globe View window, use the File->New Display Tab->Globe Display->One Panel menu. This section describes how to make plots of global satellite imagery on the Globe display. The set of steps include:
After creating a globe display in McIDAS-V, open the Data Sources tab of the Data Explorer and select the Satellite->Imagery chooser.
Once the data source has been selected, you can create the display by doing the following in the Field Selector tab of the Data Explorer:
You can move the display using the standard McIDAS-V zooming, panning and rotating functions. For this exercise try the following:
Any suitable data with navigation information (latitude, longitude, and altitude) that McIDAS-V can handle can be plotted on the globe display.