BRIDGE Map: Using satellite data to save lives after a wildfire
Each year, deadly wildfires scar millions of acres of land across the US costing billions in property damage. But even after a fire is contained and the flames extinguished, soils from burned areas become prone to erosion, creating the risk of devastating mudslides and debris flows when rainy weather moves in.
Sam Batzli is a research scientist with the University of Wisconsin-Madison Space Science and Engineering Center who is taking advantage of high-resolution satellite data to help the National Weather Service (NWS) forecast landslides and debris flows. Often, the rains that help contain a wildfire are responsible for washing away the weakened landscape because it is no longer held in place by vegetation. In many cases, says Batzli, a burned area can be vulnerable to erosion three years after a fire.
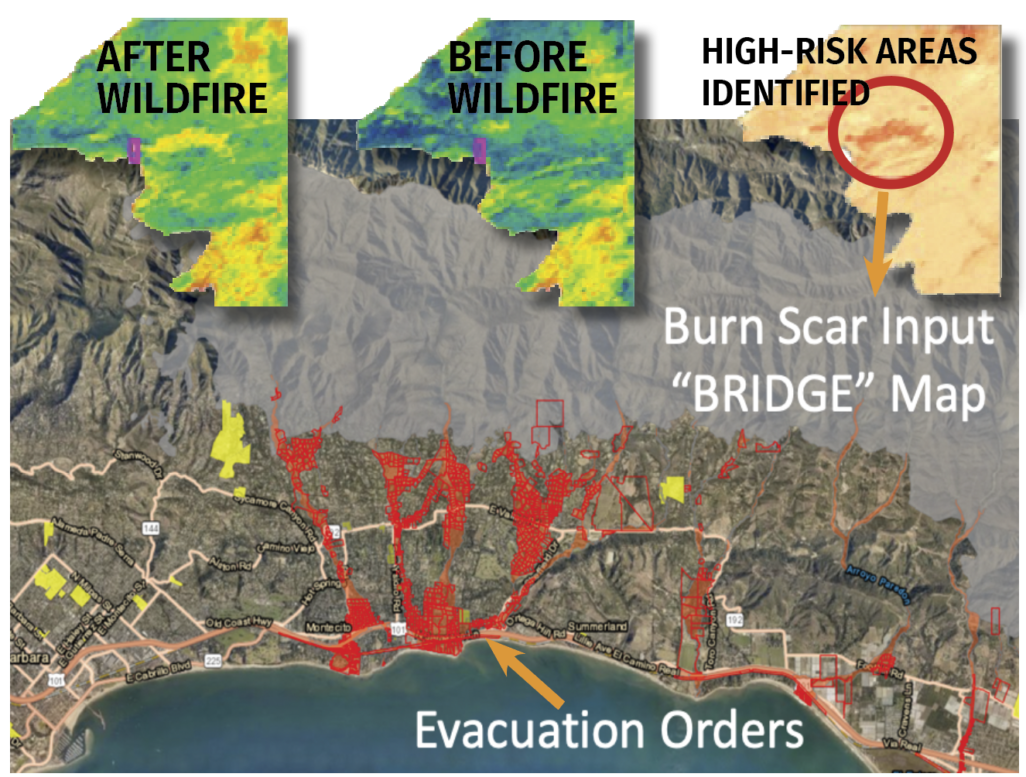
Example evacuation order map from March 05, 2019. Using the Normalized Difference Vegetation Index (NDVI), BRIDGE Map measures the amount of vegetation before and after a wildfire to determine areas at risk for future landslides. Credits: Santa Barbara County Sheriff and Emergency Operations Center and Sam Batzli, SSEC
Batzli and his colleagues are using imagery from the VIIRS imager on the Suomi NPP and NOAA-20 polar orbiting satellites to help NWS hydrologists create models to map debris flow hazards based on fire intensity estimates. Currently, the methods for mapping these areas rely on infrequent or delayed imagery from the Landsat-8 satellite. Batzli says that although the Landsat-derived map is more detailed and useful for experts on the ground, it often comes too late to be of use to NWS hazard forecasters.
Firefighters like the Burned Area Emergency Response (BAER) teams who deploy to these burned areas—sometimes before the fire is contained — rely on up-to-date information to assess the landscape, make repairs, and fortify weak areas.

SSEC scientist Sam Batzli. Credit: Sam Batzli
“When it comes to the safety of response teams and the people in nearby neighborhoods, getting accurate and timely information for forecasting debris flows is crucial,” says Batzli. “We’re working to speed up that process by producing a preliminary burn intensity map.”
The map is called a Burn Intensity Delta Greenness Estimate Map or BRIDGE Map. It incorporates before and after vegetation health data from overhead passes of the satellites. With this information it calculates changes in vegetation caused by the fire. This data is fed into NWS hydrology models — and combined with other variables such as terrain, slope and predicted rain rates—helping forecasters better identify areas prone to erosion.
The BRIDGE Map team is building a website for on-demand mapping. It will function as an interface for producing and displaying this kind of information as rapidly as possible. They expect to have the site functional by the beginning of 2020.
“Although our focus is on the major US wildfires that happen in the western parts of the country, the global coverage from Suomi NPP and NOAA-20 satellites can potentially provide this information nearly anywhere around the globe,” says Batzli.
This research is supported by NOAA’s Joint Polar Satellite System Program.