New all-hazards ProbSevere model targets tornadoes, hail, wind
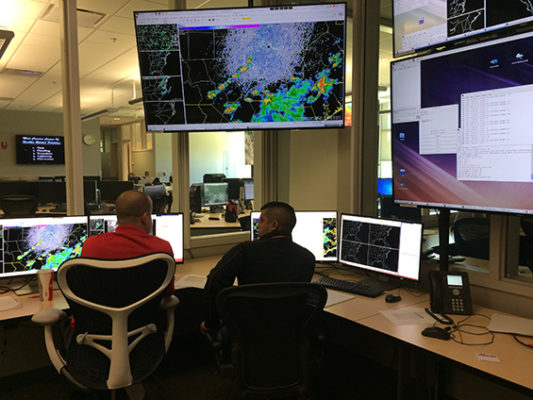
NWS forecasters evaluating new products and tools, including the improved all-hazards ProbSevere. Credit: Justin Sieglaff, CIMSS.
Pinpointing severe weather and issuing timely forecasts is a critical part of the weather forecaster’s job. Since 2011 researchers at the University of Wisconsin-Madison have been developing and improving a unique statistical model, known as ProbSevere, to help forecasters determine whether a particular storm will likely produce severe weather.
That model is getting a significant update this summer as the researchers have added the capability to target specific hazards, from tornadoes (ProbTor) to hail (ProbHail) to wind (ProbWind). Now the model can indicate more precisely the likelihood of whether a storm will produce a tornado (or hail or wind) – rather than simply “severe weather” – in the next 60 minutes.
Mike Pavolonis, a NOAA Advanced Satellite Products Branch (ASPB) scientist stationed at the Cooperative Institute for Meteorological Satellite Studies (CIMSS), leads the effort to make better use of data from Numerical Weather Prediction (NWP), geostationary satellites, radar, and lightning observations in the upgraded statistical model.
“It’s still the same core data sources [as the original ProbSevere]. It’s just different metrics from those core data sources. We utilize metrics that are especially tailored toward the individual hazards based on our understanding of the physics,” says Pavolonis.
Working with Pavolonis, CIMSS researchers John Cintineo and Justin Sieglaff have been investigating which metrics to combine and which combinations perform better in the model.
As with ProbSevere, the ProbTor’s output can be layered over radar in the form of color-coded contours based on the storm’s potential to produce tornadoes. Forecasters can also see which storm characteristics, and their values, were used to produce the overall ProbTor value, designated as a percentage. Over the course of the storm, that information allows forecasters to follow and understand why the tornado probabilities change based on what is occurring in the storm. ProbTor and the various metrics can also be displayed as a function of time in a time series plot.
ProbSevere product shows severe weather moving from Minnesota into Wisconsin on 16 May 2017 and the likelihood of storms producing tornadoes.
“[ProbTor] allows forecasters to really pick out the storms that they have to monitor most closely. And in busy situations, that’s especially useful,” says Pavolonis.
To assess its accuracy, researchers compare the ProbTor results with reports of tornadoes and post-damage assessments from the National Weather Service’s database of Local Storm Reports. Pavolonis and his team pay close attention to the relationship between the timing of when the model indicates the potential for severe weather, when warnings are issued, and when the severe weather actually occurs.
“Our model is designed to have probabilities that increase ahead of the storm so that you get the lead time to warn the public,” says Pavolonis.
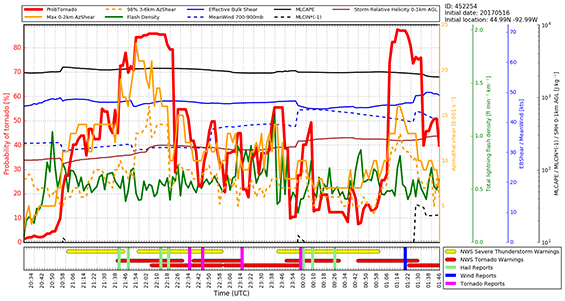
Time series of ProbTor (noted by the red line) and associated metrics compared with NWS warnings and reports of wind, hail, and tornadoes from the 16 May 2017 storms in Minnesota and Wisconsin.
For the last few years CIMSS researchers have been testing ProbSevere performance with help from NWS forecasters at the Hazardous Weather Testbed (HWT). For the first time this year forecasters had the opportunity to evaluate the newly updated ProbSevere with ProbTor, ProbHail, and ProbWind.
Both Sieglaff and Cintineo participated in the HWT this year, first in the Probabilistic Hazard Information (PHI) experiment and later in the Experimental Warning Program (EWP). The PHI is designed to help forecasters move from issuing “yes/no” warnings – that is, you are either in the warning area or not – to issuing warnings with swaths and percentages showing which areas are more likely to see severe weather and when. As Cintineo notes, “the threat doesn’t go [directly] from 0 to 90.”
The PHI adds an additional layer with the participation of emergency managers and broadcasters.
“A big part of it is the interaction between the forecasters and the information they give out, how the EMs use the probabilistic information, how do broadcasters use it or can they use it,” says Cintineo.
“Not everyone appreciates exactly what a probability means. Too many people, I think, still gravitate towards the yes or no,” adds Sieglaff.
At the EWP, the focus is on soliciting feedback from forecasters on the usefulness of ProbSevere and how it might be improved. The forecasters look at weather scenarios and see how new products complement and enhance the tools already at their disposal – specifically, radar imagery – when potentially issuing severe weather warnings.
“One of the reasons it [ProbSevere] was so well received, beyond it being scientifically valuable, is how it’s displayed in AWIPS II [the processing system used by the NWS to create forecasts]. If you put something on top of radar data that obscures the radar data, then people aren’t going to use it. So you have to be smart in how you display the data to forecasters, especially since screen real estate… there’s not a lot of it. So if you can get something on their screen that integrates well into what they are already doing, that’s important,” says Sieglaff.
Sieglaff credited CIMSS researcher Lee Cronce for his expertise with AWIPS in helping to create a ProbSevere display that works rather seamlessly for the user.
Having returned from the HWT, the team will be using the feedback and experiences of forecasters with the model to inform their continued research into improving the all-hazards ProbSevere. In addition, they have a to do list of their own known issues to resolve. Last, but not least, they are preparing the model for the higher resolution GOES-16 data; as a statistical model, it will need to be retrained on GOES-16 data for optimum performance so that it will be ready in time for next year’s convective season.
The next step: Transitioning ProbSevere to operations
Pavolonis and his team are currently producing the more general version of ProbSevere (without the specific hazards) locally and then distributing it to NWS offices across the country. However, the NWS is eager for ProbSevere to make the transition from research to operations, where it would be routinely produced, distributed, and supported by the NWS itself. Pavolonis explained that the transition involves several steps, from adjusting ProbSevere to ensure that it is fully compatible with the operational system to delivering documentation to evaluating ProbSevere’s operational performance. Pavolonis expects that ProbSevere will become part of NWS operations within the next fiscal year. And when it’s ready, the all-hazards version will follow.
This work was supported by NOAA Grant NA15NES4320001 and NOAA Grant NA15OAR4590188.
by Leanne Avila