Thunderstorm potential: Predicting cell strength over the Great Plains
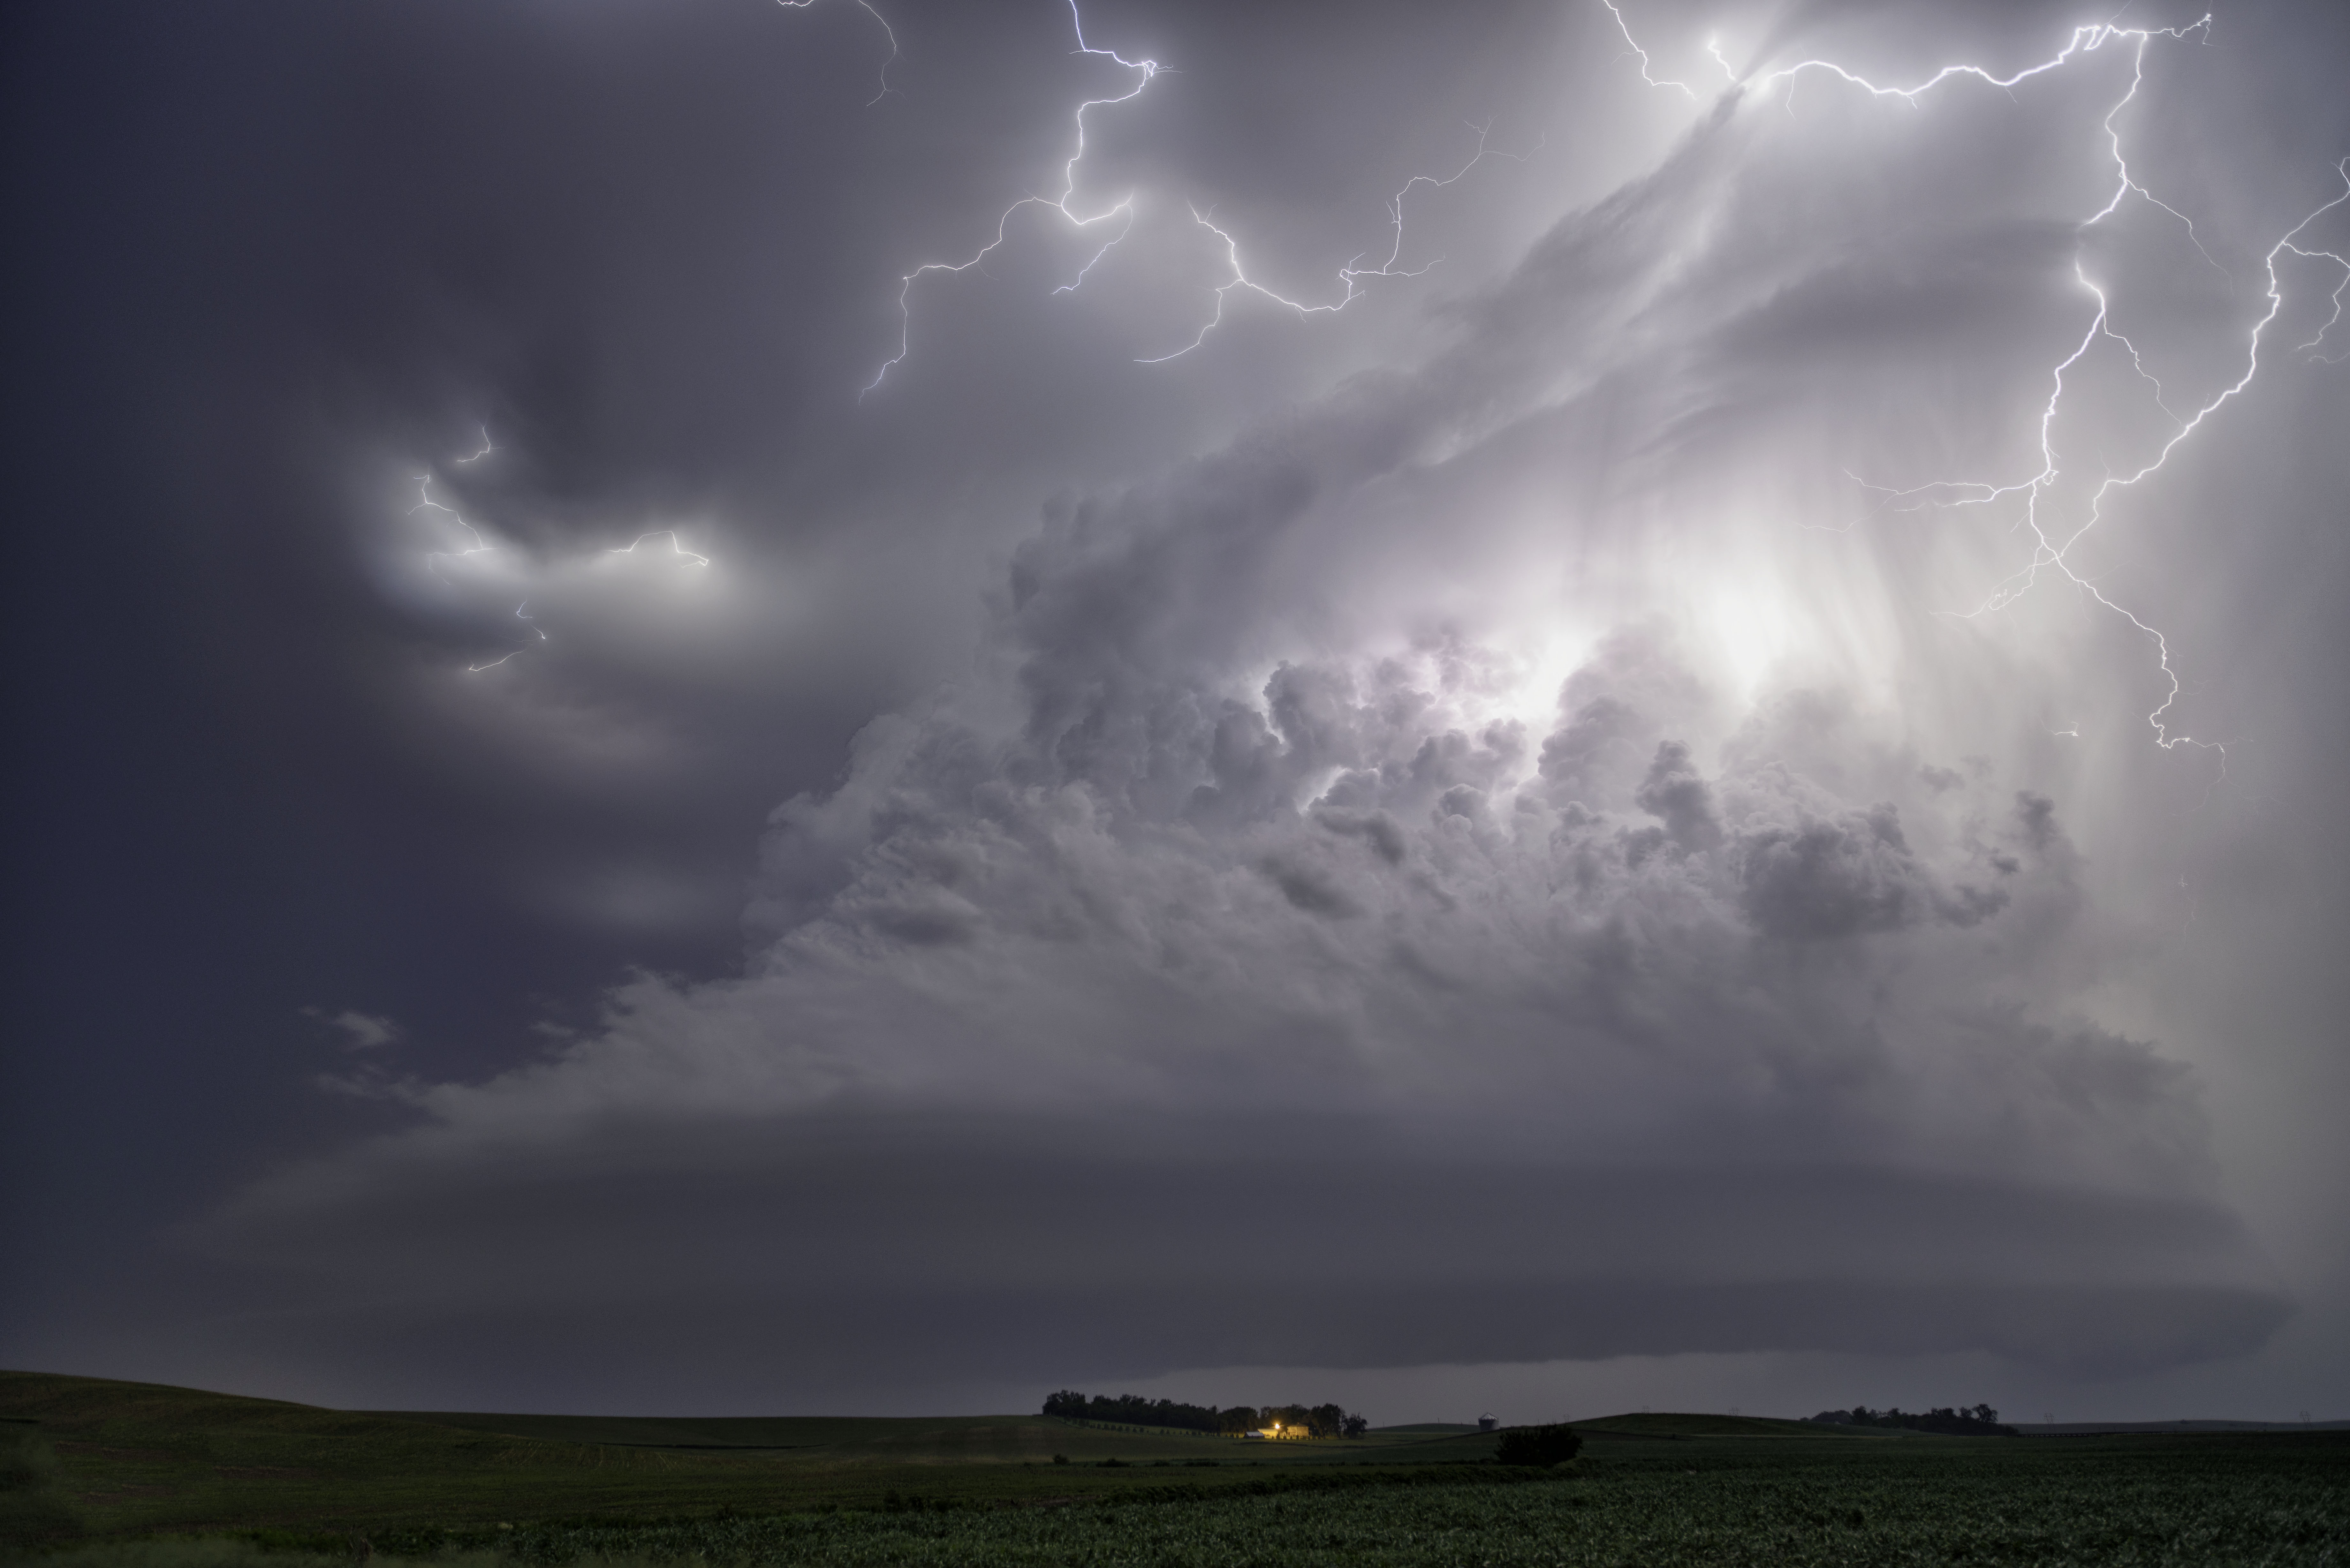
Severe thunderstorms are common in the Southern Great Plains. A promising new method to predict them in near real-time would provide another source of reliable information to forecasters in situations where every minute matters. The method matches satellite measurements to radiosonde, or weather balloon, measurements to construct a more accurate picture of convective available potential energy, known as CAPE.
CAPE is an estimate of the amount of instability in the atmosphere, which is closely related to updraft strength, says Jessica Gartzke, a recent graduate of the University of Wisconsin-Madison who worked with scientists at the UW Space Science and Engineering Center (SSEC) to conduct the study. It is calculated from vertical temperature and humidity profiles in the atmosphere. Also taken into account are the speed and height of the updraft that forms in the pre-storm phase, which can be an indicator of the danger of a possible storm.
Thunderstorm over Laurel Nebraska. Credit: Dr. Cathy Finley
It is particularly applicable to the Great Plains, arguably a region that has the highest value of CAPE anywhere in the world.
“The technology of weather satellites has evolved so that researchers can use satellite observations along with ground observations to forecast severe weather in near real-time,” says Gartzke. She, along with her advisor, SSEC scientist Robert Knuteson and co-investigators, showed that profiles of temperature and water vapor from polar orbiting satellites can be used in tandem with surface measurements to more accurately predict when severe storms will form.
That extra step of merging satellite observations with ground observations is the topic of Gartzke’s research.
“I showed that we can use the profiles of temperature and water vapor on polar orbiting satellites but you have to consider the surface measurements, too, otherwise you’ll get some unusual results,” says Gartzke.
Their article, “Comparison of Satellite-, Model-, and Radiosonde-derived Convective Available Potential Energy in the Southern Great Plains” was published this spring in the Journal of Applied Meteorology and Climatology.

UW-Madison graduate Jessica Gartzke worked with SSEC staff to better understand the convective processes involved in thunderstorms over the Great Plains. Credit: Andrea Reina
Forecasters consider a range of information, including radar, when preparing a forecast, but according to Gartzke, one of the challenges of predicting severe weather in the central United States is that weather balloons are typically launched at 6:00 a.m. and 6:00 p.m., but most thunderstorms occur in the afternoon or evening, leaving a window without current data.
This is where polar orbiting satellites come in. If there is a satellite overpass during the window created by the balloon launch, at approximately 10:30 a.m. and 1:30 p.m., for example, “this can be beneficial to forecasters because it will provide current data to help them increase the lead time for getting information out about developing storms,” says Gartzke.
Another advantage of satellites is that they capture data from a wide swath, as opposed to the single point data collection of the weather balloon, making it easier to extrapolate over a larger area – an important feature when forecasting severe thunderstorms.
The researchers used a decade of data, 2005-2014, from the Atmospheric Infrared Sounder (AIRS) on NASA’s Aqua satellite in an area over the Southern Great Plains. AIRS is an infrared sounder that measures temperature and moisture, the two components necessary to compute CAPE.
The AIRS observations were compared to radiosonde observations from the U.S. Department of Energy Atmospheric Radiation Measurement program from the same region, around Lamont, Oklahoma. Gartzke augmented an existing computer program with new code to merge the two types of data using a process consistent with methods used by the National Weather Service Storm Prediction Center.
“In our experiment, we had to account for the fact that polar orbiting sounders pass over the region at different times and at slightly different angles each time,” said Garztke. “ We did a lot of quality control – qualifications that were provided by NASA – to account for these differences.”
The challenge of comparing the data was further complicated because the 1km vertical data from the AIRS instrument are lower resolution than the ground instrument data, requiring some interpolation. The researchers processed the data more than once to ensure the accuracy of their results.
To Gartzke, the intensity of the scientific process was an introduction into how important it is to get things right. “There is a lot of making sure that everything is in order and correct; an element of perfection,” she says.
“The near real-time applications of our work are very promising,” says Gartzke. “This was my first big work and it was fascinating using the raw data and molding it into something that we could not only understand, but that could be used by others.”
This work was supported by NOAA Grant NA10NES4400013.
by Jean Phillips