New weather ‘normals’ show how Madison’s climate has changed over 40 years
The National Weather Service’s bulletins often mention when extreme weather deviates from normal. But normal is changing.
This time next year, the weather service’s 30-year average will roll over from patterns representing 1981 to 2010 to patterns established between 1991 and 2020. That shift means that an extra 2.5 inches of precipitation, less early winter snowfall, and warmer summer nights will all become normal.
The weather service issues these updates every decade to help the nation’s forecasters accurately communicate about their regions. At the same time, adjusting what counts as normal might obscure how global warming has changed climates around the country since the Industrial Revolution.
“Hopefully there will be some press around 2021 that the climate normals are changing, and just because we’ve re-established the baseline for what is normal doesn’t negate what came before,” says Jordan Gerth, a weather scientist who recently left the University of Wisconsin–Madison to join the National Oceanic and Atmospheric Administration in Washington, D.C. He still holds an honorary fellowship on campus.
To assist his own research, Gerth analyzed the changes to Madison’s average climate that will be official next year. While the 2020 data aren’t yet included, Gerth’s analysis shows Madison has become warmer and wetter over the last 40 years.
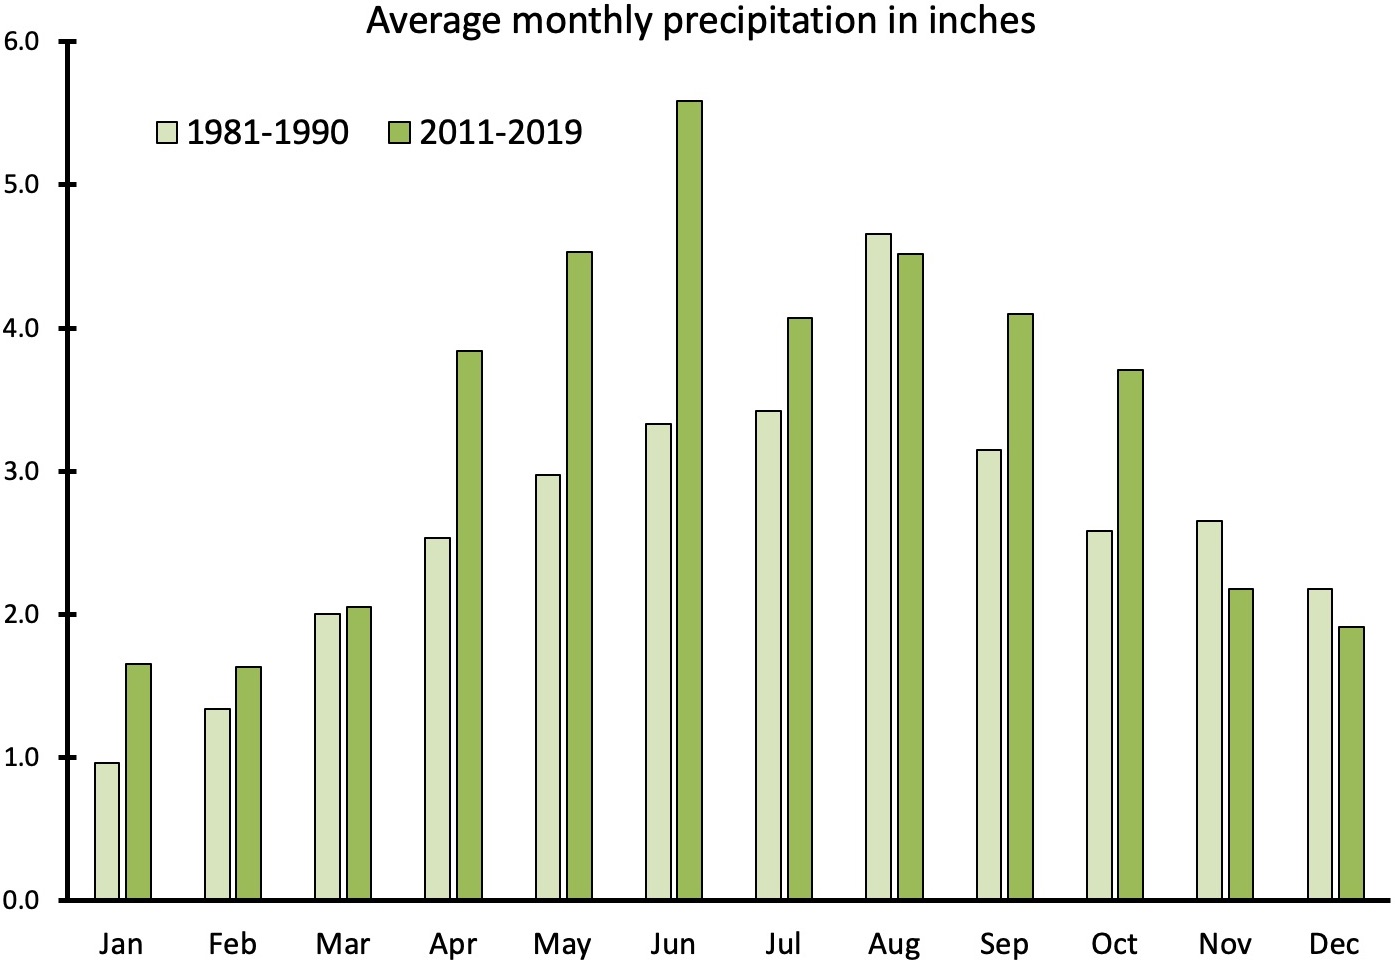
Compared to the decade from 1981 to 1990, Madison has experienced an average of eight additional inches of precipitation a year since 2011. Four of Wisconsin’s five wettest years have taken place in the last decade, and 2019 was the soggiest year for both Wisconsin and the entire contiguous U.S. since record keeping began in 1895. This new normal was on stark display in 2018, when Dane County was deluged with record-breaking rainfall that caused hundreds of millions of dollars in damage.
Warmer temperatures are also increasingly normal. Overnight low temperatures have risen more than daily high temperatures, especially from May through December. On average, December has been six degrees warmer since 2011 than it was in the 1980s. The new 30-year average for the month will add about two degrees to the previous average.
Madison’s expanding urban footprint likely accounts for some of that extra warmth. Dane County has added 200,000 residents since 1980, and city centers, with fewer trees and more heat-amplifying asphalt and concrete, tend to be warmer than rural areas. Increased greenhouse gas accumulation also contributes to the warming trend, which has consequences both for energy costs and agriculture.
“During this decade, we’ve seen delayed frosts and freezes throughout the region. That will have an impact on growing seasons,” and many farmers now consider September the fourth month of summer, says Gerth. Since 1971, Madison has gained more than 30 frost-free days.
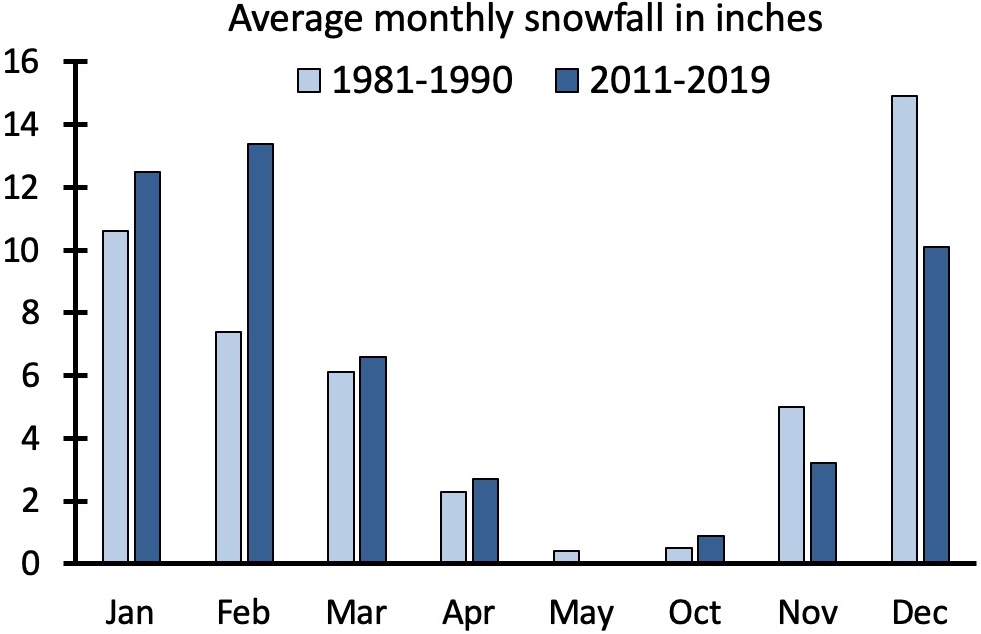
The newly balmy Novembers and Decembers are accompanied by less snowfall. But that shortage is more than made up for with heavier snows in January and February. The upshot is that an average of two additional inches of snow a year has fallen on Madison since 2011 compared to the 1980s.
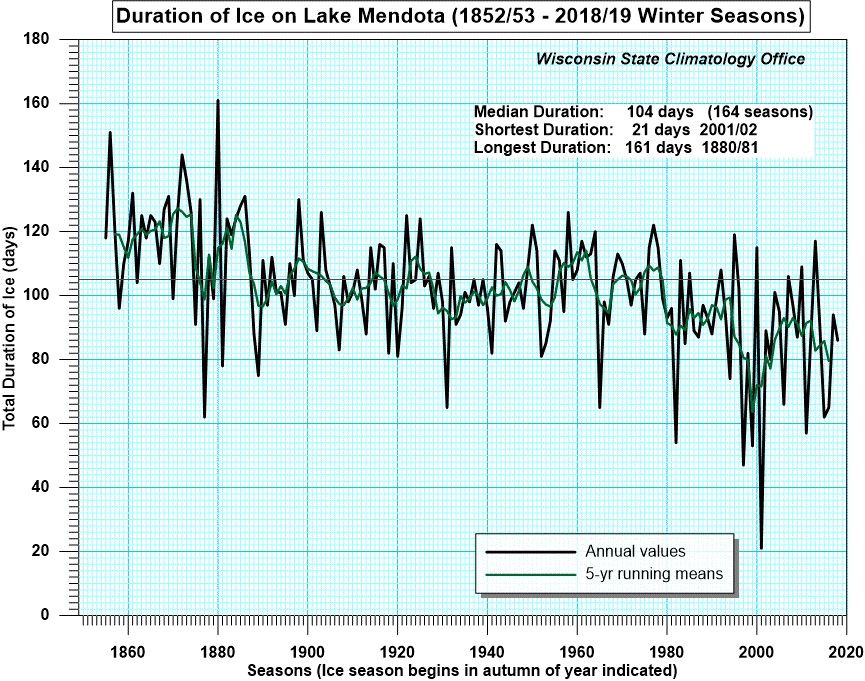
Madison has another winter climate record: its lakes. Since 1855, UW–Madison and Wisconsin State Climatology Office researchers have dutifully recorded when lakes Mendota and Monona freeze and thaw each year. The record now includes Lake Wingra.
“We want to continue tracking lake ice as long as we can, because while it’s not a temperature record, it’s an indication of how the climate is changing,” says Ed Hopkins, who keeps a close eye on the lakes as assistant state climatologist.
Hopkins travels a route around the city during the winter to visually inspect all three lakes from multiple vantage points. Lakes Monona and Wingra are considered closed when they are at least half covered with ice for a full day or more. Lake Mendota’s size and irregular shoreline make it difficult to see across the entire surface. So, according to tradition, the lake is closed, or considered frozen, when a boat can no longer be rowed from Picnic Point to Maple Bluff.
The average duration of ice on Lake Mendota has shrunk by about three weeks since record keeping began. The lake froze for the season on Jan. 12, 2020. The latest the lake has ever closed was on Jan. 30, 1932.
“Nowadays, with higher temperatures, we have to go back because sometimes the lakes break up after only a few days,” says Hopkins. This occurred for both lakes Monona and Wingra in December 2019.
This winter is the first that Lake Wingra, the shallowest of the three lakes, has closed, opened and then closed again. This mercurial behavior may become, well, normal.
But as 2021 rolls around, Gerth says, keep in mind: Normal isn’t what it used to be.