Monthly News Summary – March 2011
- “Satellites See Wisconsin” Exhibit Touches Down at Dane County Airport
- SSEC Goes to India
- New Great Lakes Water Cycle Diagram from CIMSS
- CIMSS Satellite Product Workshop in Salt Lake City
- GOES Sounder Nearcasting Implemented for NWS Western Region
- Satellite-based Convective Initation Article Published
- Using Satellites to Enhance Air Quality Understanding
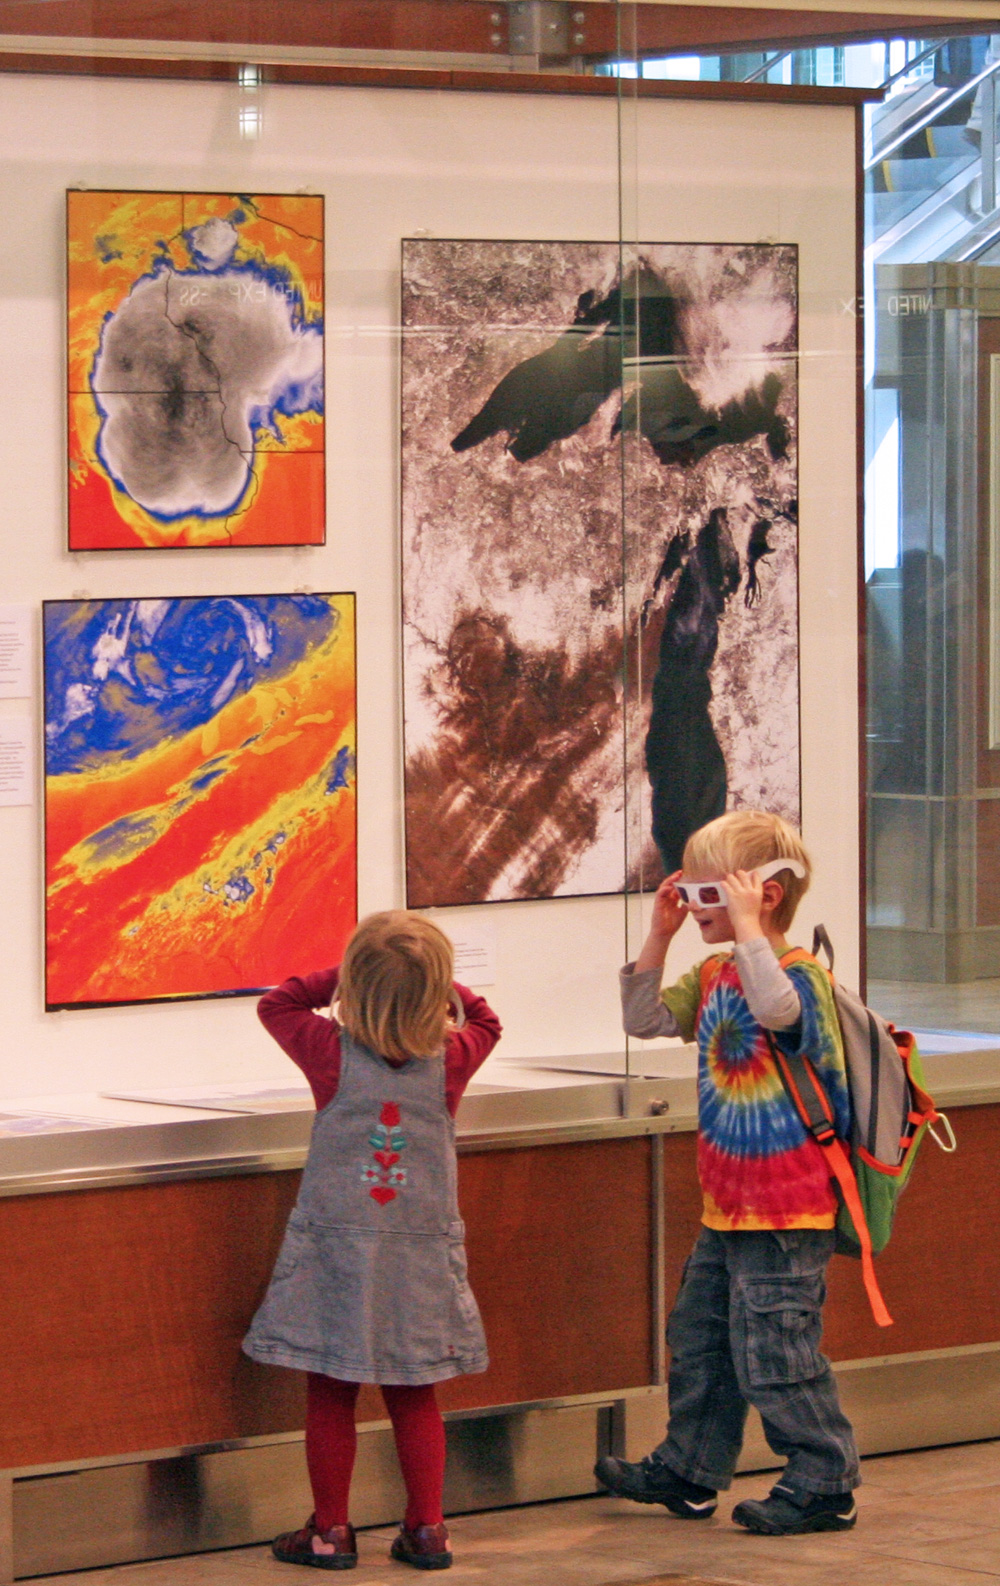
“Satellites See Wisconsin” Exhibit Touches Down at Dane County Airport

Walking through the Dane County Airport over two years ago, Steve Ackerman, Director of the Cooperative Institute for Meteorological Satellite Studies (CIMSS), noticed a gallery of images decorating the concourse and realized the airport presented the perfect venue to display the past, present, and future of satellite technology. He envisioned a comprehensive exhibit illustrating the scientific value of satellite studies as well as the stunning beauty of its images. Satellite studies of our planet’s climate were pioneered at the UW-Madison and continues at both CIMSS and the Space Science and Engineering Center (SSEC).
Ackerman met with Paula Panczenko, who is both the Director of Tandem Press and the Curator of the Art Court at the airport. Several months and a Baldwin Grant later, they put the show on the road. Images from SSEC and the UW Department of Forest Ecology were tweaked, enlarged, printed, mounted, captioned, and finally arranged to their best advantage in five large glass cases at the airport. In addition to the stunning satellite images of Wisconsin in all seasons and several different bands of EM radiation, a magnificent enclosure of towering tapestries presented SSEC’s 3D animated globe. In a central postion of honor the full-scale model of the Explorer 7 satellite anchors the exhibit.
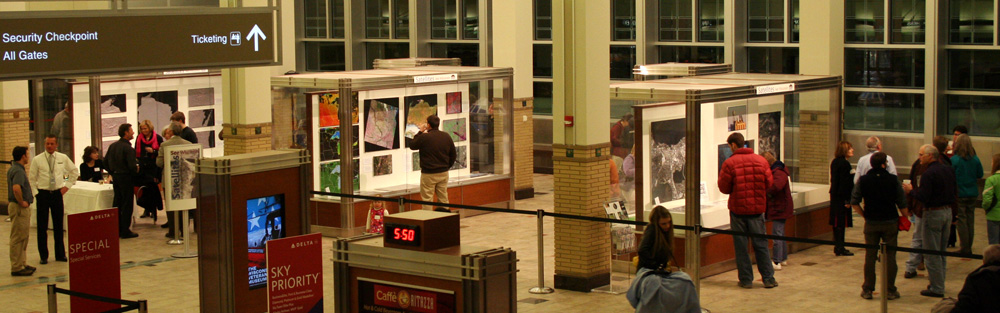
Tandem Press provided essential expertise in setting up this exhibit, including specialists to create the brochure and the spectacular drapes of the Globe enclosure as well as a critical “eye” for the images that would be included. Ackerman chaired the Curatorial Committee and made sure the exhibition reflected his original concept.
Jean Phillips and the SSEC Library Staff created a beautiful historical timeline that can be found teamed with the Online Weather Looper (OWL) display as well as with the magnificent Four Seasons tetraptych. Bill Bellon, John Lalande and Dan Pasowicz developed a new version of the OWL and an interactive web site. Rick Kohrs made it possible to bring the Globe out to the airport. Leanne Avila wrote the text for the brochure, and Maria Vasys printed (and reprinted) the images selected.
Sam Batzli not only provided numerous Landsat images, but created the panels explaining satellite orbits and how the 3-D images were created from the Space Shuttle. Liam Gumley reprocessed MODIS images to improve the resolution. Many people at SSEC worked long hours to create an exhibit that is visually stunning and draws the public into learning more about the satellites we use.
A UW press release provides more information, as does this gallery of photographs of the installation and opening night. The College of Letters and Science News and Notes covers the exhibit as well.
In addition to being spectacular, the exhibit is free and open to the public. The exhibit will remain at the Airport through September. Don’t miss it.
From 30 January through 5 February, Space Science and Engineering
Center (SSEC) scientists Paul Menzel, Paolo Antonelli, and Sanjay Limaye taught a short course in remote sensing to 24 scientists at the India Meteorological Department (IMD) in New Delhi, India. Local hosts were Dr Ashok Kumar Sharma, IMD Director for Satellite Meteorology, and Suman Goyal.
As in previous short courses, the content included materials on:
- radiation and the radiative transfer equation,
- spectral signatures from Earth’s surface and atmosphere,
- multi-spectral monitoring of land, ocean, and atmosphere,
- RGB image combinations for cloud and dust detection,
- sounding using infrared high resolution spectral data, and
- microwave detection of vertical changes of moisture in the atmosphere.
Forty hours of classroom work was split between lectures and laboratory exercises that emphasized investigation of high spatial resolution visible and infrared data (from MODIS), high spectral resolution infrared data (from AIRS and IASI), and microwave sounding data (AMSU).
Homework assignments and classroom tests verified that good progress was made in learning and mastering the materials presented.
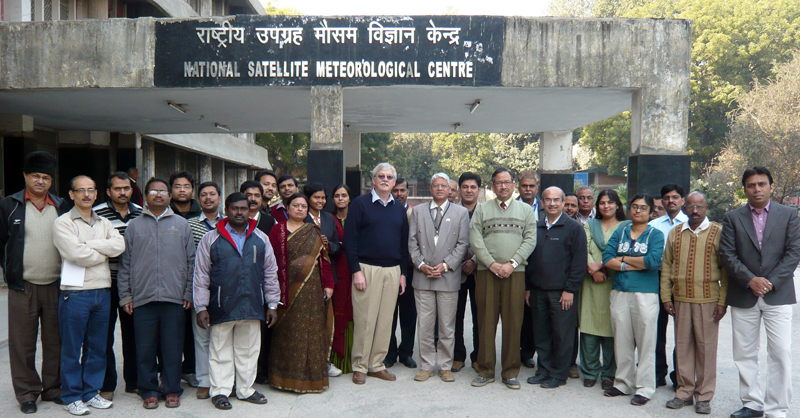
Paul Menzel (center) and workshop attendees.
Students came from across India – Kolkata, Chennai, Mumbai, Nagpur, Guwahati, Bangalore, Pune, Hyderabad, and Delhi (including SSEC visitors Puviarasan, Mitra, and Giri). The level of expertise was surprisingly good and the student engagement in the course was excellent.
Several positive comments were made; here is one of the more flattering:
“You showed a right direction and made a platform for us in satellite meteorology. The lectures given by you and your team is marvelous. This is the first time I got such a wonderful training. Even in Madison I learned a little over three months of time. But the 6 days training by you opened lot of doors for us. Now I am going through your book. In the mean time I am using the hydra to familiarize with the commands and purpose.”
Professor Menzel also gave the 7th Satish Dhawan Lecture at the India Space Research Organisation Space Applications Centre.
New Great Lakes Water Cycle Diagram from CIMSS
The Wisconsin Initiative on Climate Change Impacts (WICCI) released a climate adaptation report in February featuring a new water cycle graphic from the Cooperative Institute for Meteorological Satellite Studies (CIMSS).
Working with hydrologists from NOAA’s Great Lakes Environmental Research Lab (GLERL) and Wisconsin Sea Grant, CIMSS commissioned an artist to create an image highlighting human water consumption in the natural water cycle. The diagram can be found on page 46 of the report, which is available for download from the WICCI site.
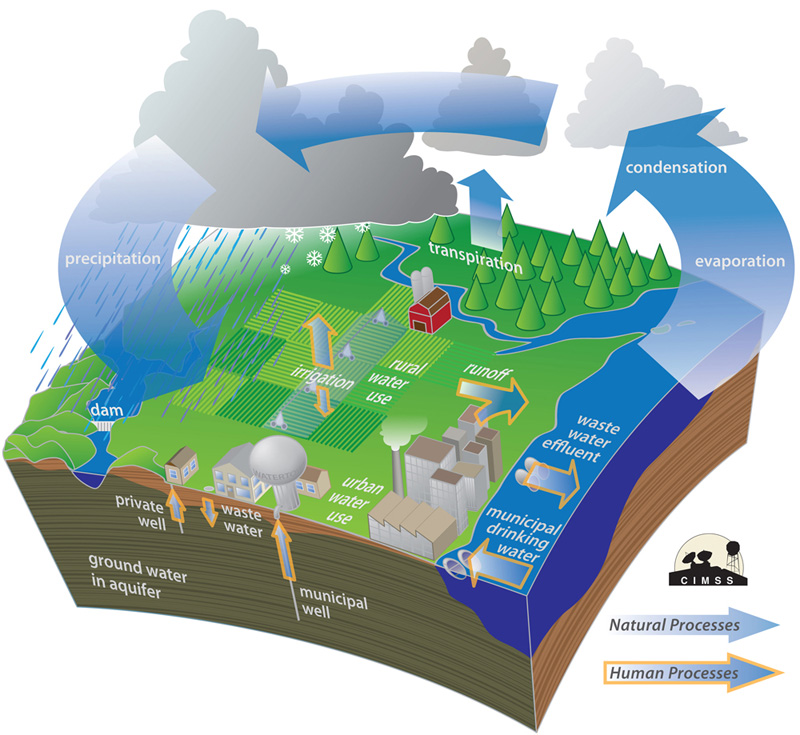
Great Lakes Water Cycle Diagram in WICCI Report.
CIMSS Satellite Product Workshop in Salt Lake City
On 16-17 February 2011, Cooperative Institute for Meteorological Satellite Studies (CIMSS) and Center for Satellite Applications and Research (STAR) scientists conducted a workshop in Salt Lake City, UT, with staff from the National Weather Service (NWS) Western Region (WR) Headquarters, the NWS Salt Lake City Weather Service Forecast Office (WSFO), and the NWS Center Weather Service Unit (CWSU) at the Salt Lake City Federal Aviation Administration (FAA) Air Route Traffic Control Center (ARTCC).
Wayne Feltz, Kathy Strabala, and Jordan Gerth (CIMSS), along with Gary S. Wade (STAR/ASPB), presented information on CIMSS products, some of which are already available (via the NWS Advanced Weather Interactive Weather Processing System (AWIPS)) with others to be implemented or in development. These products serve to prepare NWS forecasters for day-1 use of future GOES (Geostationary Operational Environmental Satellite)-R data.
One day of the workshop utilized remote access, via webinar, to include staff from other NWS WR WSFOs as well as other CIMSS and ASPB presenters in Madison, WI (Tim Schmit, Robert Aune, Scott Bachmeier, and Scott Lindstrom). A variety of current GOES data (Imager and Sounder), NASA MODIS (MODerate resolution Imaging Spectroradiometer) imagery, and simulated imagery were demonstrated as proxy GOES-R data to be used for forecasting, nearcasting, and aviation applications.
Areas of observational data needs noted by NWS staff were also part of the process, with the intent to gauge where applications from satellite data might be effective.
GOES Sounder Nearcasting Implemented for NWS Western Region
The nearcasting model, developed at the Cooperative Institute for Meteorological Satellite Studies (CIMSS), is now generating hourly nearcasts of atmospheric instability for the National Weather Service Western Region in real-time. The model uses temperature and moisture profiles measured by the GOES-11 Sounder to produce 9-hour nearcasts of atmospheric de-stabilization.
The nearcasts are useful for locating areas where severe thunderstorms are most likely to occur.
Satellite-based Convective Initation Article Published
A paper titled “Nowcasting Convective Storm Initiation Using Satellite-Based Box-Averaged Cloud-Top Cooling and Cloud-Type Trends”, authored by Justin M. Sieglaff, Lee M. Cronce, Wayne F. Feltz, Kristopher M. Bedka, Michael J. Pavolonis, and Andrew K. Heidinger, was published in the January 2011 Journal of Applied Meteorology and Climatology.
This paper describes using Geostationary Operational Environmental Satellite (GOES) imager cloud typing methodology and cloud top cooling rates using the 10.7 micron infrared channel to determine which maturing cumulus clouds were likely to grow into significant convection. The technique was shown to have a probability of detection of 55% and a false alarm rate of 25%. More information and real-time quicklooks from University of Wisconsin convective initiation methodology is available online.
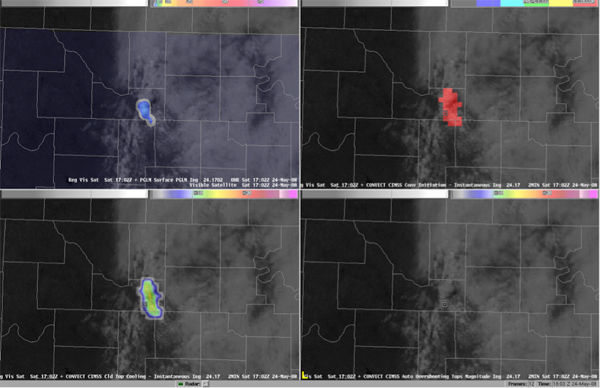
4-panel display within AWIPS of Lightning Mapping Array (LMA) 8-km Psuedo-Geostationary Lightning Mapper (top left), GOES imager UWCI convective initiation (top right), GOES imager UWCI cloud-top cooling rate (bottom left), and GOES imager overshooting-top magnitude (bottom right) for the 24 May 2008 archive case event.
Using Satellites to Enhance Air Quality Understanding
A press release from UW Communications highlights efforts on using satellite data to study connections between energy, transportation, climate, and air pollution by a team including CIMSS Director Steve Ackerman and CIMSS researcher R. Brad Pierce.