Tracking Hurricane Sandy
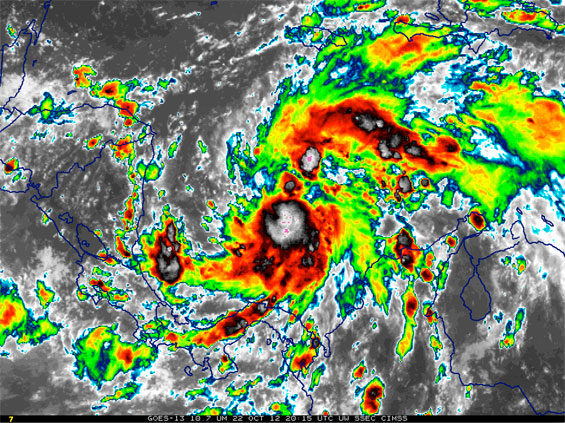
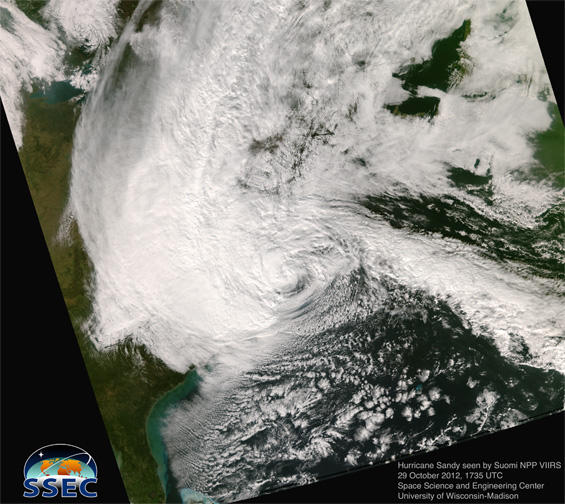
Hurricane Sandy began its savage life on 22 October 2012, when a tropical depression in the Western Caribbean Sea was upgraded to tropical storm status. Two days later, Sandy had made the grade to hurricane and was sweeping northward across Jamaica and eastern Cuba, spreading death and destruction in its wake. Roaring up the East Coast, Sandy made a fateful left turn and thundered into the mid Atlantic states, some of the most densely populated areas in the United States, on the evening of 29 October 2012.
As of this writing the full extent of the cost in lives and property has not been determined, but the economic impact is on the order of tens of billion of dollars. As fearful as Sandy became, its effects could have been far worse had the warnings not come so early and been so clear.
Researchers at the UW-Madison Space Science and Engineering Center (SSEC) collect and provide critical data from satellites – data such as wind speed, temperature and moisture – that forecasters depend on to analyze the path and intensity of tropical cyclones.
By the time Sandy had hit the Bahamas on Sunday, computer models based partially on the assimilation of satellite data were predicting that the storm would hit New Jersey late Monday afternoon.
“This was arguably an unprecedented forecast, giving the coastal population a good five to six days of lead time,” Chris Velden, senior researcher at the Cooperative Institute for Meteorological Satellite Studies (CIMSS), said. “The models gave the National Hurricane Center adequate time to fine-tune their forecasts, which ultimately saved a lot of lives.”
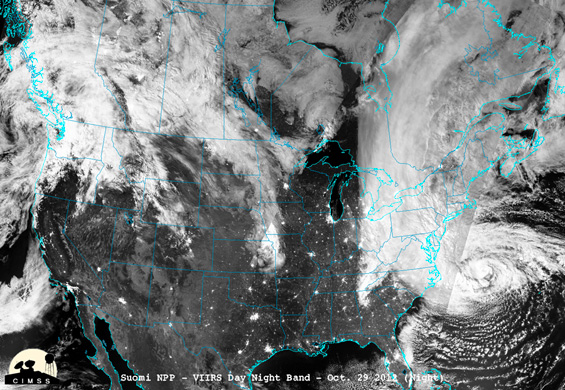
Polar-orbiting satellites, such as the Suomi NPP with its capability of supplying visual spectra images of the storm even at night, and geostationary satellites, with their broad range of scanning abilities, followed the storm’s every move.
The Geostationary Operational Environmental Satellite (GOES)-13 was placed into Rapid Scan Operations mode to monitor Sandy. GOES-14, the eventual replacement satellite for GOES-13, focused its Super-Rapid Scan Operations for GOES-R (SRSOR) imager on Sandy beginning on 25 October, providing a nearly steady stream of unique 1-minute interval scans which, given the scale of the storm, is very close to a live feed.
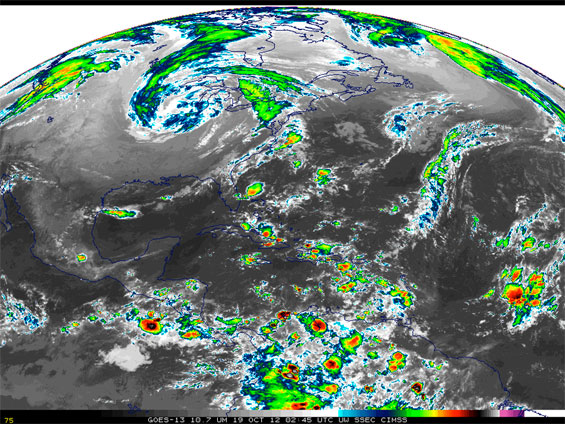
GOES-13 (GOES-East), in geostationary orbit at the Equator and 75 W longitude, was well-positioned to capture the entire lifecycle of Hurricane Sandy. An animation of 10.7 µm IR images shows Sandy’s evolution, at 3-hourly time steps, from incipient tropical wave, to a hurricane hitting Jamaica, to a system with an almost subtropical storm appearance off Florida. Note the relentless expansion of the system as it moves towards the northeast part of the US.
Another way to visualize the life cycle of Sandy is to examine a Lagrangian animation,
where the GOES-13 10.7 µm IR images remain centered over the core of the storm.
As research meteorologist Tim Schmit (NOAA/NESDIS) said, “The 1-minute super rapid scan imagery allows us to see what is happening, as opposed to what has already happened.”
The special 1-minute imagery also foreshadows what will be routinely available from the next generation geostationary satellite series (GOES-R), scheduled to be launch ready in October 2015. These unique scans were collected and made available to the National Hurricane Center and others on a daily basis by SSEC and the NOAA NESDIS Advanced Satellite Products Branch at the UW-Madison.
The SSEC Data Center also collated their images into many YouTube videos which were quickly posted (and gathered a combined total of over one million views – including the ‘recast’ NASA videos). These animations enhanced researchers’ abilities to visualize the storm. Never before has a hurricane been scanned at such high of a repeat rate for so long.
In many ways – its sheer size, the central pressure, and the still-undetermined scope of the damage it caused – Hurricane Sandy was a record-breaker. We do not have the ability to prevent such a natural disaster, so our best protection is early and accurate predictions of such a “super-storm.” Computer models are making better and better such predictions of these events. Satellite data and products such as provided by NOAA/NESDIS and SSEC are major contributors to that success.
More information:
- CIMSS Satellite Blog – Coverage of Hurricane Sandy
- GOES-14 Real-Time SRSOR animations – GOES 1-Minute Imagery
- Satellite imagery Youtube videos of Hurricane Sandy
- ASPB GOES-14 Imager SRSOR page: Movies and GOES-14 SRSOR information
- Suomi NPP Satellite Captures Mid-Atlantic Blackouts
- CIMSS Tropical Cyclone Page


