Explaining Greenland’s Record-Breaking Ice Melt of 2012
If the Greenland Ice Sheet (GIS) were to melt in its entirety tomorrow, it would raise global sea levels by 24 feet. Second in volume only to ice-covered Antarctica, the GIS is 2400 kilometers (1500 miles) long, 1100 kilometers (680 miles) wide and as much as 3 kilometers (1.8 miles) thick. That’s nearly 3 million cubic kilometers of ice.
It won’t melt overnight, of course, but researchers are following record-breaking melting events that have been observed across most of the GIS.
In a paper to be published 04 April 2013 in “Nature” Ralf Bennartz, a professor in the Department of Atmospheric and Oceanic Sciences and scientist with the Space Science and Engineering Center at the University of Wisconsin-Madison, examines one part of the complicated puzzle that Greenland’s climate presents.
“In July 2012,” Bennartz says, “a historically rare period of extended surface melting raised questions about the frequency and extent of such events. Of course, there is more than one cause for such wide-spread change. We focused our study on certain kinds of low-level clouds.”
The University of Wisconsin, together with other institutions, maintains an atmospheric research experiment at the National Science Foundation’s Summit Station, a research facility located on top of the GIS at a height of 3200 m above sea level. This experiment, which is known as ICECAPS (Integrated Characterization of Energy, Clouds, Atmospheric state, and Precipitation at Summit), provided invaluable data and insights into the different factors causing the melt event.
“You can say we were really lucky to be right there when the melt happened,” Bennartz continues.
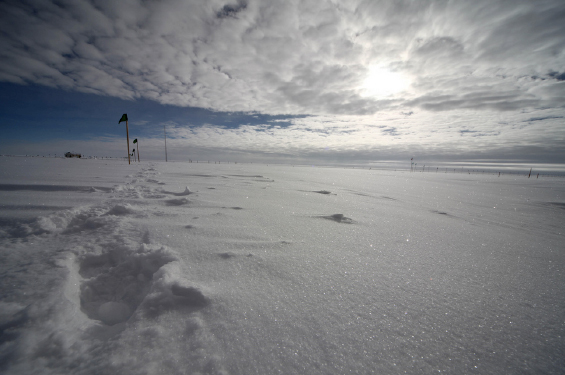
Low-level, liquid-bearing clouds over the Mobile Science Facility at Summit Station in central Greenland. Photo by Ed Stockard.
Satellite observations show an increase in the extent of the GIS melt since at least 1979, but the July 2012 event set a new record in melt extent. Examination of long-term melt records obtained from ice-core projects at Summit Station indicate that such events occurred only about once every 150 years over the last 4000 years.
“The July 2012 event,” Dave Turner of NOAA-NSSL, one of the lead investigators, explains,, “was triggered by an influx of unusually warm air, but that was only one factor. In our paper we show that low-level clouds were instrumental in pushing temperatures up above freezing.”
Low-level clouds usually reflect solar energy back into space, while also radiating infrared energy downwards, back to the surface. That is only one element within a complex interaction of many conditions, such as wind speed, turbulence, temperature and humidity. In addition, heat transfer on the surface depends upon the snow’s ability to conduct the heat received from solar radiation as well as the heat exchange between different layers of snow.
When cloud thickness and temperature conditions are right, these clouds can be thin enough that, instead of reflecting most of the solar energy away from the surface, they allow some of it to pass through, while still “trapping” infrared radiation at ground level. The extra heat energy available to the surface pushes temperatures above freezing. That is exactly what happened in July 2012 over large parts of the GIS.
Current climate models tend to underestimate the occurrence of this particular cloud type, thus limiting those models’ ability to predict cloud response to Arctic climate change and possible feedback mechanisms. By using a combination of surface-based observations, remote sensing data, and surface energy-balance models, this study not only delineates the effect of clouds on ice melting, but also shows that this type of cloud is common over both Greenland and across the Arctic.
“We know that these thin, low-level clouds occur frequently,” says Bennartz. “Our results may help to explain some of the difficulties that current global climate models have in simulating the Arctic surface energy budget. Above all, this study highlights the importance of continuous and detailed ground-based observations over the GIS and elsewhere. Only such detailed observations will lead to a better understanding of the processes that drive Arctic climate. ”
The research team drew together scientists from various institutions — collaborators included NOAA NSSL scientist Dave Turner, University of Colorado scientist Matt Shupe, University of Idaho professor and ICECAPS lead principal investigator Von Walden, Konrad Steffen of the Swiss Federal Institute for Forest, Snow and Landscape Research, UW-Madison research associates Nate Miller and Mark Kulie, and graduate students Claire Pettersen (UW-Madison) and Chris Cox (U-Idaho).
The Summit-based ICECAPS experiment is a NSF-funded joint effort between the Universities of Idaho, Wisconsin, and Colorado, and Oklahoma, with additional contributions from NOAA’s Earth System Research Laboratory (ESRL), NOAA’s National Severe Storms Laboratory (NSSL), and the DOE Atmospheric Radiation Measurement (ARM) program.
Additional articles can be found at:
National Oceanic and Atmospheric Administration (NOAA).
Cooperative Institute for Research in Environmental Studies (CIRES).