Monthly News Summary – October 2006
Dust may affect hurricanes
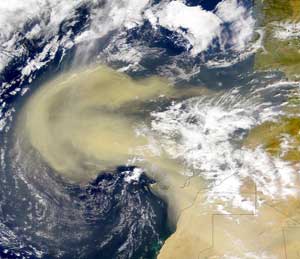
Originating over the Saharan Desert, the SAL, a mass of dry air laden with dust, causes temperature inversion and vertical wind shear. When present over the Atlantic, the effects of the SAL can hinder the intensification of tropical weather.
In search of explanations and predictions during hurricane season, the media frequently turn to the Cooperative Institute for Meteorological Satellite Studies(CIMSS). CIMSSresearch has contributed to improvements in tropical cyclone prediction and to a better understanding of these storms. An October 10 press release from UW-Madison announced the publication of a recent CIMSS study that showed a connection between dust from the Sahara Desert and hurricane activity in the Atlantic Basin.
In a study described in Geophysical Research Letters on October 10,Amato Evan, Andy Heidinger (NOAA at SSEC), and Chris Veldenworked with Jon Foley, also of UW-Madison, to analyze 25 years of satellite data. According to the UW-Madison press release, the trio noticed a correlation between stronger dust storms in the Sahara Desert and less intense hurricanes in the Atlantic. The release also noted that this correlation could help improve hurricane forecasts in the future because forecasters will include atmospheric dust as a factor in prediction models.
The release triggered media attention around the globe. Related articles appeared on web sites for the BBC, France’s International Herald Tribune, New York Times, ABC, MSNBC, and CNN. The story was a top story on CNN and was the main story on the network’s Science and Technology page. The release itself was translated into French, Spanish, Portuguese and Russian. Articles about the study also appeared in over 150 news outlets across the US.
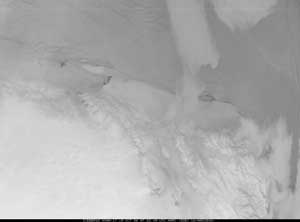
Images like this one of the Ross Ice Shelf allow researchers to track iceberg movement. Click the image to go to SSEC’s Antarctic Meteorological Research Center’s iceberg image page.
Alaskan storms affect Antarctic ice—A huge storm in Alaska generated an ocean swell that broke a large iceberg floating more than 8,300 miles away in Antarctica, according to a October 2 press release from the University of Chicago.Jonathan Thom andShelley Knuthcontributed to this study. Thom helped set up equipment to monitor the icebergs and Knuth provided daily satellite images, which are produced by SSEC’s Antarctic Meteorological Research Center. Related articles appeared on CNN, LA Times, Washington Post, and Scientific American.

More than 80,000 fans pack into Camp Randall for UW-Madison football games. CIMSS researchers help keep the fans safe by providing Camp Randall Point Forecasts for the UW Campus Police.
Special report: Jason Brunner forecasts for UW-Madison Homecoming— Preparing for severe weather events on GameDay can be quite difficult given that more than 80,000 fans pack into Camp Randall Stadium. The point weather forecast is very important for the safety of the players and the fans attending the football game. The Camp Randall Point Forecast keeps campus police aware of pending severe weather situations on GameDay such as flooding, lightning, and extreme temperature changes.
Planning for GameDay forecasts begins early in the week. Meteorologists at CIMSS examine results from computer forecast model runs that are initialized twice per day (0 and 12 Universal Coordinated Time (UTC)). Model results show forecasts of meteorological parameters at the surface and in the troposphere. Meteorologists also examine satellite animations. Specifically, they look for evidence of circulations of water vapor in the atmosphere that might indicate severe weather.
In addition to forecast models and satellite data, GameDay forecasters analyze surface station reports and observations from weather balloons of conditions higher in the atmosphere. These data show time tendencies in meteorological parameters such as temperature, humidity, pressure, and winds. This information is compared to the forecasted parameters of the models to see if the models are conveying the atmospheric conditions correctly and to assess how much the forecasted parameters deviate from reality.
A meteorologist from CIMSS provides a forecast of temperature, wind, precipitation, and any severe weather threats to campus police about 48 hours before kickoff to give the police an idea of what the weather is expected to be like from a few hours before to a few hours after kickoff. Campus police receive another forecast about 24 hours before kickoff, which provides more detail about the weather conditions for GameDay. Specifically, this forecast mentions if drastic temperature changes are expected due to a frontal passage or if thunderstorms are expected and the duration of any severe weather threats.
Finally, once GameDay arrives meteorologists provide what is called a Nowcast, which gives a detailed point forecast for Camp Randall Stadium and the meteorological conditions expected from a few hours before to a few hours after kickoff. Satellite and radar animations are used to monitor trends in thunderstorm and precipitation development over Dane County and Camp Randall Stadium, and surface station reports over southern Wisconsin are monitored for drastic temperature changes. The meteorologists are in direct contact with campus police during GameDay and provide updates regarding impending severe weather threats. The preparations for the Camp Randall Point Forecast start early in the week and continue through Badger GameDay in order to provide the police with the necessary information to keep fans safe from inclement weather.
Data for Google Earth—The Google Earth community now has access to atmospheric and global surface data. Amato Evan and Andy Heidinger(NOAA at SSEC) developed this product using data from an instrument called the Advanced Very High Resolution Radiometer, which flies on polar-orbiting satellites. Evan and Heidinger process data from this instrument as a part of the Pathfinder Atmospheres-Extended project. The dataset for Google Earth includes cloud information, sea surface temperature, dust fraction, aerosol optical depth, troposphere temperature, and total precipitable water. A post on the Google Earth community says “any Earth scientists or curious civilian” will find this product “useful and quite informative.”
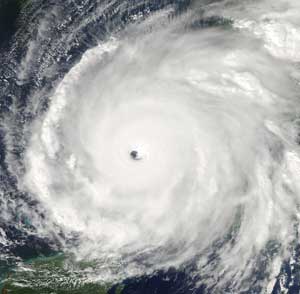
The CIMSS MODIS team produces a variety of images of public interest. This image shows Hurricane Rita, which pounded the Gulf Coast during the 2005 hurricane season.
The many uses for MODIS—Researchers with CIMSS engage in a wide variety of activities involving data from theModerate Resolution Imaging Spectrometer(MODIS), an instrument aboard polar orbiting satellites in NASA’sEarth Observing System. MODIS data has a broad range of applications—many of which are possible because of the MODIS team at CIMSS. CIMSS scientist Kathy Strabalarecently presented an overview of CIMSS MODIS activities.
Access to direct broadcast MODIS data is one service provided by CIMSS—thanks to the antenna encased in the golf ball-shaped dome on the roof of the Atmospheric, Oceanic and Space Sciences building. This antenna receives MODIS data as the EOS satellites come over the horizon near Hudson Bay in Canada until the signal disappears near Mexico’s Yucatan Peninsula. The CIMSS MODIS team posts this real time data to a web site.
The team also generates a variety of images of public interest, including those of hurricanes, dust storms, and tornadoes. The MODIS team also provides data to the Great Lakes Coast Watch. Other groups use CIMSS MODIS data to monitor sea ice, track migrating marine mammals, and initialize numerical weather prediction models.
CIMSS MODIS data also facilitate research within SSEC. One group gathers data about polar winds. Another group uses MODIS in an air quality monitoring project known as IDEA. Users of SSEC’s PDA Animated Weather online service can also access MODIS data.
In addition to providing data to a variety of groups, the CIMSS MODIS team develops and distributes software to process MODIS direct broadcast data. The goal of this software package is to encourage rapid improvement of related data applications. The group also conducts remote sensing workshops around the world to help others use MODIS data.
Satellite data contributes to air quality study—CIMSS researcherChris Schmidt helped out during a field campaign to study air quality in Texas and the surrounding region. Schmidt traveled to Texas for part of the study to interpret satellite data. His assessments aided the deployment of the various aircraft and ships involved in the study. Many satellite products were used including fire hot spots and emissions, aerosol optical depth, and surface UV fluxes. Scientists from UW-Madison will also participate in post-mission analyses of satellite and ground observations. These analyses will provide insight into the atmospheric processes impacting regional air quality in the southern United States.
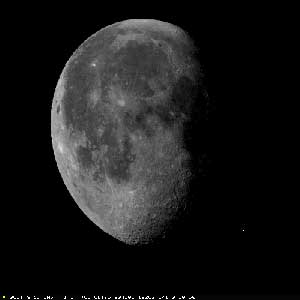
Recently, SSEC and NOAA’s Advanced Satellite Product Branch provided images of the moon from GOES-13 to NOAA’s Center for Satellite Applications and Research.
Seeing the moon—Since the latest U.S. geostationary satellite, GOES-13, began transmitting data in June, SSEC has participated in testing efforts. Recently, SSEC and NOAA’s Advanced Satellite Product Branch provided GOES-13 images of the moon to NOAA’s Center for Satellite Applications and Research. The Man-computer Interactive Data Access System (McIDAS), a software system developed and maintained by SSEC, processed the moon images. This data will help researchers assess how useful it is to use images of the moon for calibrating satellite instruments.
Powering through an eclipse—Previous geostationary satellites have lost power as the Earth blocks the sun, but the design of GOES-13 allows it to collect data during eclipses. On September 12, scientists had the opportunity to investigate satellite data gathered during an eclipse. CIMSS researchers studied the effects of direct solar radiation on the satellite’s observations to help NOAA determine if the data is useful. They found that the solar radiation corrupts the imager’s five spectral bands. NOAA will continue to analyze the data to determine if portions of the scans during eclipse periods are useful.
From the blogosphere—The CIMSS Satellite Blog features noteworthy satellite images with brief descriptions and information about interesting weather. Research meteorologist Scott Bachmeier maintains the blog. Posts during September primarily detailed intriguing atmosphere phenomena as seen at one-minute intervals by GOES-10—a former U.S. geostationary satellite that SSEC’s Data Center has helped to guide to the satellite’s new position as the weather satellite over Latin America. On September 22, Bachmeier posted a 200-image animation of severe thunderstorms developing over Arkansas and Missouri. Typical satellite scans provide imagery every 15-30 minutes. Images every minute allow researchers to closely observe cloud features as they develop. Continue to check theCIMSS Satellite Blog to learn more about the role of satellite data in meteorology and to see impressive views of Earth from space.
Monitoring the ozone—CIMSS researchers recently improved atechnique to use geostationary satellite imagers to monitor ozone concentrations. The team used data from the visible and infrared imager aboard METEOSAT-8, a European geostationary satellite, to demonstrate the capabilities of the ozone algorithm. Retrievals using the algorithm agreed well with measurements from the Ozone Monitoring Instrument aboard NASA’s Aura satellite. CIMSS’s total ozone product depicts ozone movement in the atmosphere and shows hourly changes well.
UK receiving polar wind data—The UK Met Office began receiving direct broadcast polar wind data on September 18. SSEC personnel have helped set up direct broadcast systems in Norway and in Antarctica. Satellite instruments gather data about the polar regions at a frequency that allows scientists to estimate the speed and direction of winds in that area. This data helps fill observational gaps in weather prediction models creating a more complete picture from which to start the model and, consequently, better forecasts.
Meetings and Field Experiments
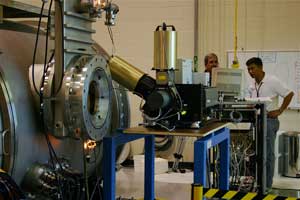
The GIFTS instrument is in a thermal vacuum chamber to replicate space-flight conditions. GIFTS technologies will provide immense improvements over current satellite-based remote sensing equipment.
Testing GIFTS: An update from Wayne Feltz and Joe Taylor—The NASA New Millennium Program (NMP) Geosynchronous Imaging Fourier Transform Spectrometer (GIFTS) instrument was designed to demonstrate new and emerging technologies, and to provide immense improvements to satellite-based remote sensing of the atmosphere from a geostationary orbit. The GIFTS instrument provides high temporal, spectral, and spatial resolution radiances that contain information about the current thunderstorm potential, wind structure, and cloud properties—all of which are important for improved forecasting of severe weather situations. Thermal vacuum testing of the GIFTS Engineering Development Unit (EDU) was performed at the Space Dynamics Laboratory and completed in May 2006. SSEC, NASA Langley Research Center, and Space Dynamics Laboratory conducted a ground-based measurement field program at Logan, Utah from September 5-27.
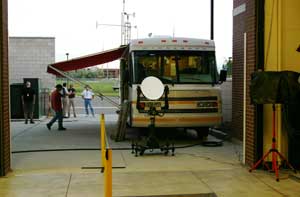
As part of the GIFTS testing, SSEC sent its mobile weather lab, the AERIbago. The instruments in the ‘bago helped validate the measurements taken with the GIFTS EDU.
SSEC deployed a suite of meteorological instruments within a Winnebago, called the AERIbago, to validate GIFTS-EDU measurements. The GIFTS-EDU instrument was in a thermal vacuum chamber to replicate space flight conditions. GIFTS viewed the outside world via a window in the chamber and an external mirror. The scene mirror provided a means of directing the GIFTS field of view, allowing an upward-view into the earth’s lower atmosphere.
Simultaneously, other radiometrically and spectrally calibrated measurements from an Atmospheric Emitted Radiance Interferometer (AERI) allowed researchers and engineers to calibrate and validate the integrity of the GIFTS radiance measurements. Radiosonde, surface meteorological station, and ceilometer measurements were also taken to characterize the atmosphere at the time of the GIFTS measurements and for use with calculating GIFTS-like radiance measurements for validation.
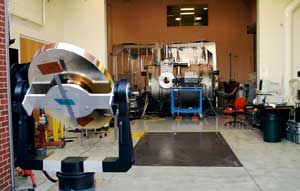
A scene mirror helped the GIFTS instrument look up into the Earth’s atmosphere.
This experiment was designed to show that GIFTS-EDU makes accurate radiance measurements before further work is conducted to make the instrument ready for space flight. The GIFTS instrument is expected to be ready for launch in 3-years with further resources, and should provide a huge technological and scientific leap is providing risk reduction for the next generation of geostationary weather satellite technology.
September was a record month for SSEC’s PDA Animated Weather (PAW) online service. The site received approximately 277,000 requests—topping the previous record set in February 2006.
PAW creator Russ Dengel recently added a new estimated precipitation overlay for the European maps. Dengel also began to develop an RSS feed option for the service.
Recent reviews of PAW have continued to spread praise for the service to new audiences. In August, the Sniffer discussed the merits of PAW in a podcast. The Sniffer is a podcast series that investigates “what the future holds.” The podcasters learned of the PAW from a member of the McIDAS Users’ Group, a group that relies on SSEC’s McIDAS software system to process meteorological data
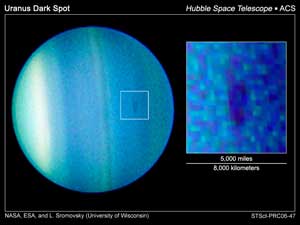
A team of researchers led by Larry Sromovsky saw a dark spot on Uranus using the Hubble Space Telescope.
Uranus images—As summer came to a close in the Midwest, a team of researchers led by SSEC’s Larry Sromovsky used NASA’s Hubble Space Telescope to capturetwo previously unseen events on Uranus: an eclipse by one of the planet’s moons and the appearance of a dark spot.
University Communications released the image of the eclipse on August 31. Several news organizations picked up the story including Aviation Week. In their September 11 issue, Aviation Week featured the image and a brief explanation.
The Space Telescope Science Institute released the dark spot image on September 28 through the Hubble web site. Sromovsky’s team first noticed a dark spot in Uranus’ atmosphere in late August. Frequently seen on Neptune, a planet that is similar in size and atmospheric composition, this is the first definitive image of a dark spot on Uranus. Sromovsky says that the spot likely indicates cloud circulation forming a vortex with characteristics similar to hurricanes on Earth.
After the image release, the Space Telescope Science Institute posted the image on its home page with a link to the story. The image later appeared in many media outlets. New Scientist Space published an article about the dark spot soon after the release. The New York Times also printed a piece about the image on October 3. Other media appearances include:SpaceRef.com, PhysOrg.com, DailyIndia.com, and the Discovery Channel’s web site.
Speaking about Pluto—Since the International Astronomers Union decided to strip Pluto of its status as a planet, several planetary scientists have voiced opinions on the matter including SSEC’s Sanjay Limaye. In addition to his work at SSEC, Limaye also serves as the press officer for the Division of Planetary Science (DPS) and spoke about the DPS statement on Pluto in an USA Today article on August 17. Limaye commented on the IAU resolution in an article on SciTechToday.com on August 25. “I think this is utter nonsense,” the article quotes Limaye. “How can we ever say whether something has cleared out its orbit?” Locally, Limaye helped theWisconsin State Journal’s Susan Lampert Smith discuss the City of Madison’s resolution to maintain Pluto as the ninth planet in the solar system. In the September 7 article, Limaye says that the debate over Pluto’s status is “unproductive” and that it detracts from other important planetary science activities.
Thunderous words—Tom Achtor explained some concepts contributing to characteristics of thunder in the Wisconsin State Journal’s Curiosities column on September 14. Thunder, Achtor said, “is a sound wave moving away from the lightning in all directions at the speed of sound.” Variations in the sound of thunder are mostly a result of how close someone is to where the lightning originates. The Curiosities column poses questions to UW-Madison researchers every Thursday.
During September, Rosalyn Pertzborn and Sanjay Limaye traveled to Germany and Belgium to spread the word about the European Space Agency’s explorations of Venus and NASA’s mission to Jupiter. On September 20, Pertzborn and Limaye presented the “Mysteries of Venus” learning modules to educators and scientists during a Venus Express workshop at the EuroPlanets Conference in Berlin, Germany. They also participated in a similar workshop on September 25 at the Brussels Institute for Research in Aeronomy (BIRA) in Belgium. Pertzborn and Limaye lead the education and outreach efforts for Venus Express in the U.S. While in Brussels, Limaye and Pertzborn talked to 500 middle school students at the International School of Brussels. They both told the students about Venus Express. Limaye also presented information about global climate change and Pertzborn gave a presentation about NASA’s investigations of Jupiter—the Juno Mission. Pertzborn is in charge of Juno education and outreach
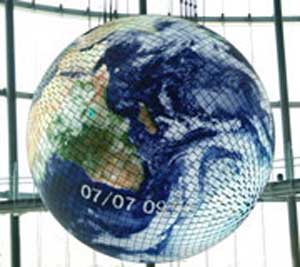
SSEC provides data for Geo Cosmos, a 21′ diameter globe suspended in the lobby of Japan’s National Museum of Emerging Science and Innovation.
Data from UW-Madison as the “symbol exhibit” in Japanese museum—Weather satellite data from SSEC has helped over three million visitors to Japan’s National Museum of Emerging Science and Innovation see what our planet would look like from space.
The data allows the museum’s executive director, who is also Japan’s first astronaut, realize his vision of sharing his experience in space with the public. The director, Dr. Mamoru Mohri, visited campus on September 22 to thank SSEC for providing the data over the past five years and to learn about new products that the museum might find useful.
Over one million LEDs light up the data from SSEC to create an impressive display of information about Earth’s atmosphere. The sphere, known as Geo Cosmos, has a diameter of a little over 21 feet and weighs 20 tons. Hanging in a large atrium at the museum’s entrance, Geo Cosmos is the centerpiece exhibit.
While the Geo Cosmos prominently displays several SSEC products, Dr. Mohri welcomes more. During his visit, Rick Kohrs showed Dr. Mohri a new product that displays earthquakes occurring around the world in animations that span eight days.
Special thanks to Jason Brunner, Wayne Feltz, and Joe Taylor for their help with this edition of In the News.