Monthly News Summary – September 2005
Katrina
by Terri Gregory
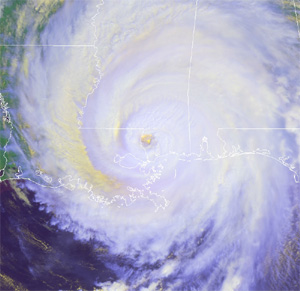 image courtesy of Dave Santek |
| This image shows Hurricane Katrina on August 29. Satellite data and some techniques developed by UW-Madison’s Tropical Cyclones group helped provide adequate evacuation notices. |
As the Hurricane Katrina disaster unfolded in the southern U.S., it seemed that all the Midwest could do is watch and pray. Great disaster fell on the southern coast, but the toll on human life would have been even greater without the warning people did receive. Satellite data and some techniques developed by theUniversity of Wisconsin-Madison’s Tropical Cyclones group helped provide a believable evacuation notice. According to team leader Chris Velden, about three million lives were saved by timely evacuation and a “spot-on” forecast of landfall. Columnist Bill Wineke noted Velden’s comments in the September 7 edition of The Wisconsin State Journal.
 |
|
Although Hurricane Katrina devastated New Orleans, about three million lives were saved by timely evacuation and a “spot-on” forecast of landfall.
|
Since 1982, the Tropical Cyclones group in UW-Madison’s Cooperative Institute for Meteorological Satellite Studies has been developing specialized forecasting techniques with weather satellite data using its Man computer Interactive Data Access System (McIDAS) and other tools. Most of its work is done far ahead of an actual hurricane, providing on-line analyses and imagery to forecasters long before landfall. In a thank you to the group, National Hurricane Center director Max Mayfield noted that CIMSS imagery and products would see much future use.
One set of images combines data from two different instruments on NOAA polar orbiting satellites. Western Carolina University (in North Carolina) is using one of these images in their call to students and faculty in New Orleans, if they need a place to stay and go to school or teach.
As part of an ongoing study called TROPEX, the CIMSS Tropical Cyclones team is producing special wind measurements from GOES-12 data for Atlantic tropical storms throughout the summer. The measurements are made hourly, available about an hour after the data are received, and use rapid scan imagery (images are taken very frequently over a small area, in this case, the U.S.).
Informing the public
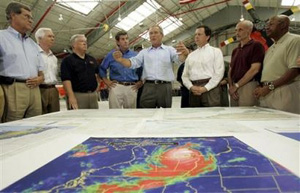 Photo by the Associated Press, in Yahoo News, September 2 |
|
The color enhancement of the satellite image in front of President Bush was developed at SSEC using its Man computer Interactive Data Access System (McIDAS). A listener to National Public Radio said that the “red blob” inspired him to evacuate his Gulf Coast home.
|
SSEC’s researchers in CIMSS also aided the media with science-related questions. Reporters contacted the Tropical Cyclones group from local television stations WISC-TV channel 3 and NBC-TV15, WIBA radio, and Madison’s newspapers. Images with the signature SSEC enhancement appeared on CNN and in USAToday, and the home page of theUniversity of Wisconsin-Madison.
Aaron Nathans, a reporter from The Capital Times, interviewed CIMSS researcher Tim Olander who noted that the Tropical Cyclones Web site transfers huge amounts of data to researchers, forecasters and the general public for any major tropical storm, but especially so for Hurricane Katrina. The site experienced 1.8 million hits during the storm’s life time.
Howard Berger spoke with Ryan Foley of the Associated Press’s Madison office, detailing current and past CIMSS contributions to hurricane science. An article based on the interview appeared in the daily newspaper of Eau Claire, WI.
Ron Seely, science and environment reporter for the Wisconsin State Journal, interviewed Jim Kossin of the CIMSS Tropical Cyclones group for an analysis of hurricanes and climate change (August 31). Seely noted that, while an increase in number of hurricanes may not be linked to global warming, scientists can connect an increase in storm severity to climate change. Seely said that MIT’s Kerry Emanuel “showed in his studies that the increases in storm intensity are directly related to increases in the average surface temperature of the world’s tropical oceans.” Kossin noted that sea surface temperature provides a hurricane’s fuel.
Kossin also spoke with Josh Wescott of WIBA radio news and appeared on NBC TV channel 15. Tony Wimmers explained his new analysis technique, Morphed Integrated Microwave Imagery at CIMSS, for WISC Madison TV channel 3.
Special imagery and analyses
The images and animations may load slowly …
 |
|
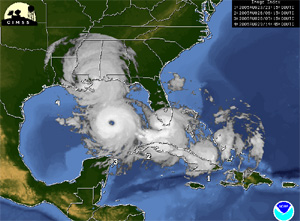
The Tropical Cyclone group generated this montage of Hurricane Katrina. An archive of montages from previous storms is available on the group’s Web site.
|
The Tropical Cyclone research team generates a “hurricane montage” product that displays the path of each tropical cyclone using snapshot images of the storm during its lifetime. As a storm traverses the ocean basin the montage procedure continually modifies the area of coverage to capture the lifecycle of the developing cyclone. The product is available on the CIMSS Tropical Cyclone Web site in real time with an archive of various montage images for selected storms worldwide.
On August 27, a day before Hurricane Katrina rapidly intensified to Category 5 strength, GOES-12 Rapid Scan Operations imagery indicated a series of convective bursts near the center of the storm, followed by rapid axisymmetrization of these features as they wrapped around the eye. GOES wind shear derived products also showed that the hurricane was moving into a low shear environment, a factor that was conducive to further intensification. Scott Bachmeier, who prepares the GOES Gallery, made a QuickTime animation of Katrina that covers August 25–29, with one GOES image per hour (missing 05:45 UTC).
SSEC’s Direct Broadcast facility received MODIS images of New Orleans and the surrounding area on August 27, 30 and 31. On the FTP site, the numbers at the beginning of each image name identify the year, month and day the image was taken. Bands 1, 4 and 3 show true color. Bands 7, 2 and 1 show false color (water is dark, land is bright). All the images are 250 meter resolution.
Other details are as follows:
20050827 was taken by NASA’s Aqua satellite passing over the Gulf coast at 19:00 UTC
20050830 by Terra at 16:50 UTC
20050831 by Aqua at 19:00 UTC
Other resources
Shortly after Katrina made landfall, NOAA’s National Geodetic Surveyprovided aerial photographs of hard hit areas of Louisiana, Mississippi and Alabama. Images were taken in direct support of the recovery effort.
AOS graduate student Benjamin Johnson noted that Google maps “provides a useful point of comparison against the aerial photos … . Choose New Orleans, LA and click on the ‘satellite’ button. Some of the aerial images require rotation to match up.” Another Google interactive map shows flood levels in New Orleans.
A different experience
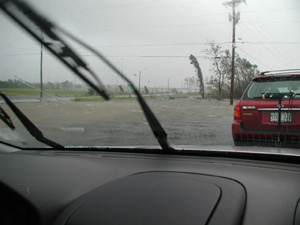 photo courtesy of the group’s hurricane Web site
|
|
The daring band of storm chasers promises to continue to add information (including a log), images, and videos to their Web site.
|
Atmospheric scientists associated with UW-Madison’s Department of Atmospheric and Oceanic Sciences (AOS) wished to experience storm conditions, yet remain relatively safe, and traveled to Mississippi ahead of Hurricane Katrina. Michael Morgan (professor), Greg Postel (Ph.D. 1999, now in Kansas City, KS), and Ross Lazear and Nick Bassill (graduate students) left Madison, WI Friday night and arrived in Slidell, LA the next evening, and the next day drove to Gulfport to see the storm tide. They took refuge in Mosspoint, MS, north of Pascagoula, and left Monday noon (August 29) for Wisconsin. Tales from their journey will lend verisimilitude to severe weather lessons. While not comparable to those of people who lived on the Gulf, some of their experiences were stressful, like wading through waist-deep flood waters to escape their hotel (when Morgan’s glasses were blown off his face and Bassill lost his cell phone in the flood waters). The daring band of storm chasers promises to continually add information (including a log), images, and videos to their Web site. Ed.Note: Please don’t try this yourself.
Other news and how to help
- University of Wisconsin–Madison hurricane help
- Washington Post “How to Help” page
- New York Times complete coverage
- U.S. Environmental Protection Agency Hurricane Katrina Response
Besides people cited in the article above, thanks go also to SSEC researchers Kris Bedka, Liam Gumley, Dave Santek and Dave Stettner, and Grant Petty (AOS and SSEC), for contributing to this story.