Monthly News Summary – November 2003
UW Lidar Tests NASA’s ICEsat
This issue of SSEC In the News covers news and research results primarily from October 2003. Use images freely with credit to the Space Science and Engineering Center, University of Wisconsin-Madison, but please notify SSEC’s Public Information Officer.
Since October 8, UW–Madison’s lidar group has helped NASA test its ICEsat, the Ice, Cloud and land Elevation Satellite that is studying changes in polar ice thickness and extent. UW’s High Spectral Resolution Lidar measures the same atmospheric quantities measured by the Geoscience Laser Altimeter System (GLAS) on the satellite and when ICEsat is directly overhead about every eight days, the two laser beams can meet to calibrate the GLAS. The UW instrument operates at the same wavelength as NASA’s instrument.
Both UW and NASA instruments measure the heights of clouds and aerosols, such as haze and particles in smoke, in the atmosphere from precise measurements of the travel time of the laser pulses and, in the satellite’s case, calculated against its orbit and instrument orientation. Both instruments are used in climate studies; the UW lidar is used particularly to finely tune numerical models of climate and weather, leading to increasingly better weather forecasts and a better understanding of Earth’s climate. According to NASA, this is “the first time any satellite has made vertical measurements of the Earth through the use of an onboard light source.”
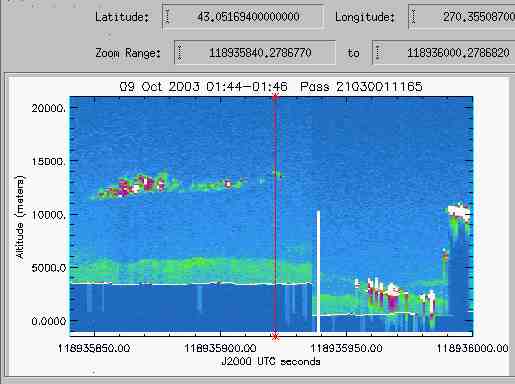 |
NASA’s Jim Spinhurne, an ICEsat researcher, provided this image of ICEsat data received during the October 9 overpass of Madison, WI. The vertical red line is located over Madison. The altitude scale is offset because the lidar was pointed off-nadir to aim at Madison. |
Calibration tests depend on the weather to work well. Thick clouds keep the beams from meeting. The scientists hope for cirrus clouds or haze for the maximum effect, and best test—something we can see through, but that gives a nice signal. The satellite did pass directly over Madison on the evening of November 11, but heavy clouds and drizzle obscured the view. When the weather is right, the UW lidar is seen as a green beam and the satellite as a green flash, as captured in the video on the UW Lidar Web site. It is expected that testing will continue throughout the satellite’s life.
The UW lidar program has been developing lidar instruments since about 1965, under the leadership of Edwin Eloranta, a scientist in the Department of Atmospheric and Oceanic Sciences. The researchers and engineers working with him are employed by the Space Science and Engineering Center (SSEC). Both groups are housed in the Atmospheric, Oceanic and Space Sciences Building, which also houses some research centers in the Institute for Environmental Studies.
The Arctic High Spectral Resolution Lidar will take measurements in the Arctic ice near Barrow, Alaska starting in 2005. The lidar is being tested in the top story of the building, beamed through a skylight. Images like the one below are now available on the Web where you can see how the lidar viewed the atmosphere on any day since the beginning of October.
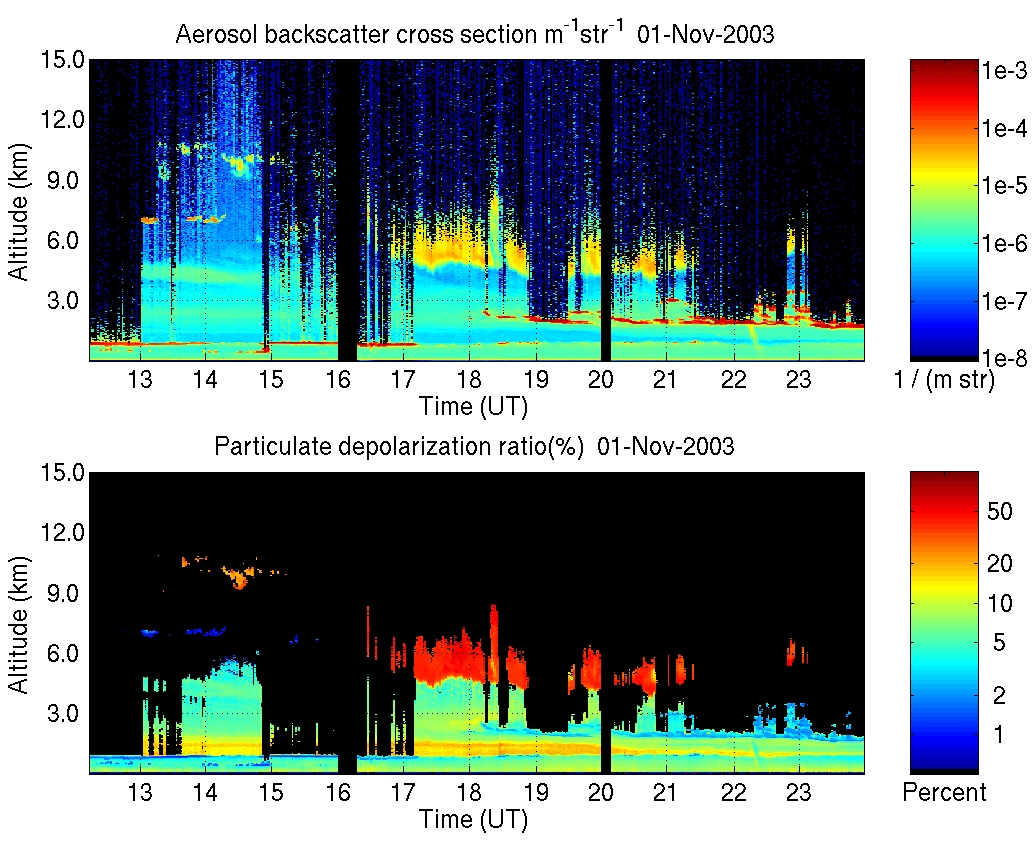 |
This pair of images shows the level of cloud on November 1 over Madison, WI. Altitude in kilometers above the earth’s surface is shown to the left of the image. Time in international units (UTC) is along the bottom. 13 (1300 UTC) is local 8:00 a.m. Wherever the image is dark, the lidar could not “see” through the cloud.The top image shows a cross section of the lidar beam through Madison’s atmosphere. The color bar to the right of the image shows the density of the cloud, with red the most dense and yellow less dense. Pale blue are hazes.The lower image shows the degree of polarization, dependent on the roundness of the drops in the clouds, so that the drops closest to spherical (absolutely round) are blue (water clouds). Irregular-shaped particles are red (in this case, ice clouds). |
University Communications released our information about the test on October 8, before the October 9 test. It was published in Wisconsin Week Wire and in Student NewsLink for October 8. Jamie Lyn Hofmeister covered the test for the Wisconsin Technology Network, noting that good data was received in the initial test. Wisconsin Week, the campus newspaper, published the news in its Advances column on October 22. SpaceDaily covered the tests and UW lidar research on November 5.
Antarctica
B-15, the behemoth iceberg that calved from the Ross Ice Shelf in 2000, is second-to-none in size no longer. On October 10, the giant berg broke in two. At 3,496 sq. km, B15A is no longer the world’s largest iceberg. According to the Antarctic Sun, “That title goes to C19A, at 5,659 sq. km, which is residing in the so-called ‘iceberg graveyard’ near Durmont D’Urville, west of the Ross Sea.” As always, SSEC’s Antarctic Meteorological Research Center noticed the change. (Scroll down to B-15A Breaks Up!) UW–Madison’s Communications office released the information at about the same time as did the National Ice Center, who named the new piece B-15J. Wisconsin Week Wire covered the breakup on October 15. NASA TV featured the story with NASA MODIS images at noon, 3 p.m., and 6 p.m. that day. The news was the Top Story on Goddard Space Flight Center’s Web site on October 16, thanks to Goddard’s science writing team.
In the past three years, several fragments have broken off B-15. J is the latest, and biggest, at about a third of the whole B-15A. The Antarctic Sun, newspaper for the continent, began its seasonal publication with a November 2 issue, featuring the breakup. Douglas MacAyeal, U. Chicago glaciologist and AMRC colleague, expects small pieces to continually break off the ‘rough edge’ of the break. MacAyeal noted that “These might be more of a worry for getting into [McMurdo] Sound than the big pieces.” He and SSEC researcher Jonathan Thom and technicians placed an Automatic Weather Station on B-15A in October. On the same day, AMRC meteorologist Shelley Knuth visited the AWS on C-16, placed in 2001, to check its status. A UW–Madison AWS is now on the three largest icebergs in the Ross Sea. A story in CNN links to the AMRC iceberg page.
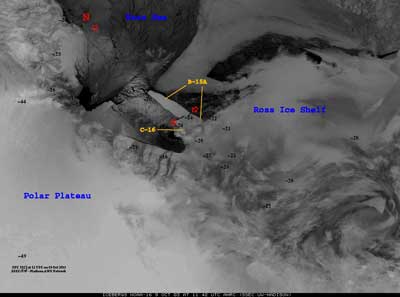 |
An image from the NOAA-16 polar-orbiting weather satellite shows B-15A ’s breakup on October 3. |
Composite Imagery Used in Books and Presentations—NHK-TV, the Japanese public broadcasting network, is collaborating with the Discovery Channel in live broadcast coverage of the November 23 total solar eclipse over Antarctica, one of very few times that continent will ever experience an eclipse. SSEC’s Antarctic Meteorological Research Center will provide composite satellite imagery of the event. The AMRC provides composites of Antarctic routinely every three hours from whichever weather satellites take images of the continent. For the eclipse, hourly composites are planned.
Antarctic researcher Kendrick Taylor is using a water vapor composite movie to illustrate Power Point presentations he gives to the National Science Foundation and to the ice coring research community. Taylor, a research professor in Reno’s Desert Research Institute’s Division of Hydrological Sciences, finds that the movies, produced by SSEC’s Antarctic Meteorological Research Center, “are such a compelling way to show where the material in an ice core is coming from.” Taylor is Chief Scientist for the WAISCORES project which is studying paleoclimate and ice dynamics in West Antarctica.
The AMRC contributed an annotated satellite image to Captain Scott, a new book by Sir Ranulph Fiennes, a British explorer. The image, of icebergs calving in 2000, shows how the site of Amundsen’s 1911 camp site floated out to sea on one of the icebergs. Fiennes’s book is the latest of many Scott biographies, but is the only one, he says, written by an explorer who retraced the route Scott took to the South Pole. Captain Scott is published by Great Britain by Hodder & Stoughton.
Data and Imagery
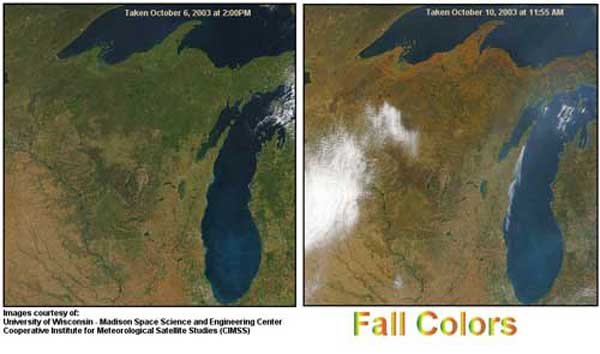
Nature’s Show—A series of Terra MODerate-resolution Imaging Spectroradiometer (MODIS) true-color images from four separate days in mid-October 2003 shows the change in vegetation color (from green to vivid autumnal colors) across the state of Wisconsin. The MODIS data were acquired and processed by SSEC’s Direct Broadcast facility and posted as received on Liam Gumley’s MODIS gallery. The CIMSS GOES Gallery displayed a series starting on October 5. Gumley provided images of Wisconsin from October 6 and 10, showing vivid colors and dramatic change in just four days. Another image from 13 October shows the height of color in the U.S. northeast and north into Canada. NASA’s Earth Observatory posted the two Wisconsin images to show the changing fall colors. On Saturday, October 11, The Weather Channel showed them. Robyn Weeks-Hulecki, who supervises Operational Weather Graphics for The Weather Channel, said she uses the “NASA Rapid Response site for images that showcase national and international events. However, your site has great zooms of the U.S. that I cannot easily get from other web sites. I intend to keep browsing your site for MODIS images that are interesting to our viewers.” So keep a lookout, Weather Channel watchers. The images were also seen on TV in Albuquerque, NM and on WKOW TV Channel 27 and WMTV channel 15 in Madison, WI.
Significant MODIS Images—NOAA’s Operational Significant Events Imagery (OSEI) team produces imagery of significant environmental events that are visible in remotely-sensed data. While the OSEI team obtains much of their satellite data from NASA and NOAA, much of the imagery is obtained from SSEC’s Direct Broadcast site. Aiwu Li of the OSEI team said that SSEC’s data is preferred “because of its longer granules and timeliness. The Moderate Resolution Imaging Spectroradiometer (MODIS) level 1B data has been playing a vital role in hazard mapping, such as locating hot spots, smoke, snow/ice cover, volcano eruption, ocean events, etc.”
MODIS in Education—Timothy Olsen, education coordinator for the Environmental Remote Sensing Center (ERSC), used images received through SSEC’s MODIS direct broadcast facility in an interactive presentation with students at Wind Point Elementary School. Olsen presented “New Science for the State of the Lakes,” applications of remote sensing and geographic information systems for lake water clarity modeling, using the Web site LakeSat.org. The resources on the page include MODIS data provided through SSEC’s facility, via ERSC’s MODIS Image Server. The ERSC is collocated with SSEC and is part of the Institute for Environmental Studies.
Volcanoes Linked—A new, seemingly comprehensive and easy-to-use site, Famous Volcanoes, links to SSEC’s Volcano Watch page. All your volcano needs should be met in this site. Global Submit, also added SSEC’s volcano site, at a user’s request. Global Submit is purportedly a database that search engines use to add Web sites. Note that SSEC does not add new volcanoes to Volcano Watch but does provide real-time satellite imagery for each listed volcano.
Experiments and Meetings
MUG Meeting on 30th McIDAS Anniversary—The McIDAS Users Group held its annual meeting at UW–Madison’s Pyle Center in October on the occasion of the 30th anniversary of the Man computer Interactive Data Access System. McIDAS may well be the oldest continually used and supported software system in existence anywhere. In development since 1970 and first used to display and analyze satellite data in 1973, it is still used by meteorological agencies around the world to display and manipulate weather satellite data. Dave Santek, McIDAS program manager, presented a history of McIDAS, available in PowerPoint or PDF on the meeting wrap-up Web site as 30th Anniversary of McIDAS.
Participants from sites around the world learned about improvements made to McIDAS interfaces and to the system varieties. McIDAS runs on several operating systems, including the Mac OS X Panther, Unix, and Windows. They also learned about improvements made to McIDAS capabilities, such as using topographical data from the U.S. Geological Survey. For a compendium of software changes, see Software Development. CIMSS, EUMETSAT, and NOAA’s Satellite Services Division each presented examples of their own McIDAS uses.
A presentation on a possible future direction for McIDAS was given by Tom Achtor, Dave Santek, and Tom Whittaker. The goal is to advance the functionality of McIDAS to meet the challenges of the future while retaining its current capabilities. A transition plan is being investigated that will make use of the IDV (Integrated Data Viewer), being developed by the Unidata Program Office, which is based on VisAD. VisAD was developed by SSEC’s scientific visualization pioneer Bill Hibbard. See “An Experiment Looking to the Future” in the MUG meeting wrap-up for the presentation. Whittaker’s demonstration of the IDV starts at slide 19 of the Power Point.
THORPEX A-TReC Campaign—CIMSS’ Chris Velden and Dave Stettner are producing experimental wind measurements derived from GOES-12 Super Rapid Scan Operations (SRSO) for the Atlantic THORPEX Regional Campaign (A-TReC), the first THORPEX field test, taking place from mid-October to mid-December. The THORPEX research program within the long-lived Global Atmospheric Research Programme aims to accelerate improvements in the accuracy of 1 to 14-day weather forecasts for the benefit of society and the economy. It is a collaboration of the World Meteorological Organization and national agencies around the world including NOAA and NASA.
The primary goals of A-TReC are to test adaptive observing systems, targeting methodologies, and data assimilation strategies on high-impact weather events occurring in the North Atlantic Ocean. Because this campaign is held primarily over the ocean, satellite data plays a key role.
CIMSS researchers Chris Velden and Dave Stettner are coordinating effort with NOAA’s National Environmental Satellite, Data, and Information Service, NASA’s Langley Research Center and the EUropean organization for the exploitation of METeorological SATellites (EUMETSAT). CIMSS is providing very-high resolution satellite wind measurements (vectors close together at many layers in the atmosphere) from special GOES-12 rapid scans on selected mission days during the experiment. In rapid scan operations, the satellite views the same area many times in a 5–15 minute period to show detail in developing storms.
CIMSS is collecting, producing and disseminating wind data sets in real time to the THORPEX community for mission planning and support, and for data assimilation and model impact trials. The GOES winds are derived from consecutive 3-minute image loops, in infrared and visible bands.Data sets are being disseminated to the project office at the United Kingdom’s Meteorological forecast office for data assimilation and impact evaluations.
During the final month of A-TReC, SSEC’s high-spectral-resolution group will support the experiment with flights of the Scanning High-resolution Interferometric Sounder and NPOES (next polar-orbiting satellite) Atmospheric Sounder Testbed-Interferometer (NAST-I) instruments on NASA’s high-altitude research plane, the ER2, stationed in Bangor, Maine.
Planets
On Wisconsin, the Wisconsin Alumni Association’s quarterly magazine, published “Neptune’s Long Winter” in its Fall 2003 issue. Reporter Erin Hueffner covered the work of SSEC planetary scientist Larry Sromovsky and his colleagues at SSEC and the Jet Propulsion Laboratory that compares images of Neptune taken by Hubble Space Telescope over a period of years. Their research shows that, while Neptune’s winter may last 40 years, so does spring. The planet takes 165 years to orbit the sun. The researchers say “it’s late spring in Neptune’s southern hemisphere now, and, if their model is correct, the cloud bands should continue to brighten for the next twenty years.”
Tracking Fires
Documenting Western Fires—In late October the Geostationary Operational Environmental Satellite (GOES) Wildfire Automated Biomass Burning Algorithm (WF_ABBA) fire products documented the progress of the California fires near Los Angeles and San Diego. The rapid growth and intensification of the fires due to the Santa Ana winds was captured by the high temporal resolution fire detection data. Most fires burned hot enough to saturate the sensor on GOES-10, preventing estimates of size and temperature. The WF_ABBA products are produced at the Cooperative Institute for Meteorological Satellite Studies (CIMSS) by Elaine Prins of NOAA and Jolene Feltz and Chris Schmidt of SSEC’s CIMSS as part of collaborations with NOAA, the U.S. Navy, and NASA.
Elaine Prins and Chris Schmidt provided an animated series of specialized composite satellite imagery to ABC TV for a movie called “Picking Up & Dropping Off.” The GOES imagery of the Western U.S. processed with the CIMSS WF_ABBA will be used as a backdrop for the main character who is a Denver weatherman.
Impact on Air Quality—CIMSS’ fire-monitoring group is processing satellite imagery for NASA’s Langley Research Center for an air quality assessment and forecasting demonstration project. Fire products for September and October using the WF_ABBA were integrated into a real-time Web site to provide insight on the impact of fires on regional air quality. This effort is part of the IDEA (Infusing satellite Data into Environmental Applications) program, a partnership between NASA, the U.S. Environmental Protection Agency, and NOAA with the goal of improving air quality assessment, management, and prediction by infusing satellite measurements into analyses for public benefit. Wisconsin Week covered the work on October 22 in the Advances column.
William Stockwell, Research Professor in the Division of Atmospheric Sciences at the Desert Research Institute in Reno, Nevada requested WF_ABBA observations of the Biscuit Fire Complex from August 5-18, 2002. Composite WF_ABBA observations from August 5–18 of the Biscuit fire complex were provided to Stockwell with alpha-blended loops of WF_ABBA fire pixel imagery that provide evidence of smoke plumes. The WF_ABBA data will be used to estimate emissions for an ozone formation model over central California during that time.
 |
GOES-10 WF_ABBA detected fire pixel alpha-blended imagery loop of Biscuit fire complex on 16 August 2002. The Biscuit Fire Complex is located below the label in the opening frame. The loop will pause briefly to indicate regions of smoke coverage that continue to develop in the following frames. The animated gif shows a smoke plume forming over the Biscuit Fire Complex around 1500 UTC and transported along the northern coast of California. Older smoke is being transported into the northern region of the central valley. |
Brazilian Fires—Composites of unfiltered GOES WF_ABBA observed fires for August 22-29, 2003 were provided to I.F. Brown (Woods Hole Research Center and Universidade Federal Fluminense in Rio Branco, Brazil). Brown is using the data to study recent large-scale fires (3,000–10,000 hectares (ha), or about 7,400–15,000 acres) in the Alcobras colonization project where about 1,000 families live in an area roughly 15,000 ha in size. The wildfires were devastating to the area; many of the settlers’ homes burned to the ground. An unfiltered analysis indicates that there has been no temporal filtering to remove fires which occur only once in a 12-hour period. Filtering eliminates false detects that occur especially in the morning when cloud edges might be detected as possible fire pixels. Quick burning fires, such as agricultural burns, can also be eliminated with the filtering process. In general, the filtering process is more important in North America.
 |
Fires from August 22–29, 2003 observed with GOES using the WF_ABBA algorithm in the region of the Alcobras Colonization Project (outlined with a white box). An unfiltered data set was used to plot all fire flags. |
Tropical Cyclones
A flurry of media activity surrounded CIMSS’ Tropical Cyclones group as they tracked Hurricane Isabel in September. Besides media coverage mentioned in In the News for October, local radio stations CBS and WNWC, Fond du Lac’s WFDL radio, Madison’s 1170 AM, WKOW Madison Channel 27 and Fox 47 and Milwaukee’s Channel 12 all covered the research, and the storm. Both student newspapers, Daily Cardinal and Badger Herald, covered the research on September 18;Wisconsin Week Wire, the online companion to the campus newspaper Wisconsin Week, linked to Terry Devitt’s piece on the group’s analysis of the storm’s projected path. As reported in October, the Milwaukee Journal Sentinel (science reporter Meg Jones) featured the research on the front page on September 17. It also ran on line, with a quote from the National Hurricane Center of how valuable the CIMSS wind measurements were in labeling Isabel category 5 before aircraft went into the storm. On September 17, just before Isabel’s landfall, SSEC’s front page spotlight, featuring the hurricane, received 1035 different visitors from outside SSEC, a high number for that page, though not as many as those who visit the Tropical Cyclones page on any given day during hurricane season.
Montage Variations—The montage of Hurricane Isabel created by Gary Wade (NOAA, at SSEC) headed the message from Undersecretary Vice Admiral Conrad C. Lautenbacher Jr. on October 30. Lautenbacher directs NOAA; his periodic message is delivered via email to all NOAA employees. Wade created the montage from GOES-12 imagery showing the storm’s path from September 7–19. Following interest in the initial montage, or composite sequence, of once daily infrared imagery, Wade received additional requests for variations in the display, which he filled, including those for J. Shadid and R. Parrish of two different NOAA offices. All these montages are accessible in the first two sections of a Web page for customized “special products” available from the Advanced Satellite Products Branch, the NOAA group of scientists stationed at SSEC to facilitate research in satellite meteorology.
CIMSS Data and Analyses Used—The National Hurricane Center continued to refer to CIMSS analyses with Tropical Storm Kate. The emailed forecast discussion on October 1 noted, “Analyses from the CIMSS at the University of Wisconsin show that the vertical shear over Kate has decreased significantly.” Associate Professor Major Kurt Brueske used CIMSS information in his meteorology classes at the U.S. Air Force Academy. “Today,” he said on October 1, “we discussed tropical cyclone energetics using AMSU imagery from Floyd—and more recently Hurricane Juan—to help facilitate understanding how we can use weather satellites as a ‘reconnaissance’ tool.” Tapestry, a Discovery Channel affiliate, will use a minute-long hurricane movie from the CIMSS Tropical Cyclones Web page in an educational piece for schools and other institutions. The piece is aimed at the K–12 audience.
Weather Experts
Weather Guys—Jonathan Martin (professor, Department of Atmospheric and Oceanic Sciences) and Steve Ackerman (CIMSS director who also teaches in the department) appeared on the pledge drive edition of Larry Meiller’s WHA Radio call-in show on October 27. Between pleas for support, the Guys answered many general meteorology questions. People wanted to know the difference between cyclones and tornados (none, really, though the general meteorological term, cyclone, is broader), what is the coriolis effect, how does lightning strike through telephone wires, and many more. You can learn all about meteorology and climate from the Weather Guys almost every last Monday of the month by listening in Madison and the surrounding area to 970 AM or 90.7 FM or on the Web from anywhere.
Weather Research
Numerical Model Uses Satellite Data—Bob Aune (NOAA, at SSEC) is providing CIMSS Regional Assimilation System (CRAS) output for the northeast Pacific domain, including the west coast, to prepare for the American Meteorological Society’s Annual Meeting, to be held in Seattle in January 2004. This special CRAS run will show the utility of GOES-10 and other satellites as an observing system for North America. As input to the model, Aune is using derived products from the GOES Sounder, thus far three atmospheric layers of precipitable water vapor and cloud-top pressure. Other satellite products he intends to add to the model include MODIS data—high resolution total precipitable water vapor and cloud measurements, cloud thickness from the GOES sounder, cloud-top pressure from the GOES imager, and, if possible, GOES cloud-track and water vapor wind measurements. The Web page offers many ways of viewing the forecast in a number of levels of the atmosphere, all available with satellite data.
The original CRAS forecast model was based on the operational forecast model used in Australia and has been highly modified to allow it to use many types of observations from satellites. It was the first forecast model in the U.S. to use observations from the GOES satellite. The CRAS has been proven statistically to produce better weather forecasts than models not using satellite data.
More U.S. Satellite Data for Europe—As of October 7, the European Centre for Medium-range Weather Forecasts (ECMWF) is adding CIMSS clear-sky radiances from the water vapor channel on GOES-9 and GOES-12 imagers to the GOES-10 radiances they already assimilate. The ECMWF forecasts weather for all of Europe. To nearly complete tropical coverage, ECMWF also assimilates data from METEOrological SATellite (Met)-5 and –7, European workhorse weather satellites akin to the U.S. GOES
Papers, Presentations
Where SSEC staff or students are first through third authors, or, if not, the contributions are substantial.
“Validation of Satellite AIRS LST/LSE Products Using Aircraft Observations,” given by SSEC’s Robert Knuteson at the recent International TOVS Study Conference, was named best of approximately 90 oral presentations. Other authors were Brian Osborne, Henry Revercomb, and David Tobin, of the University of Wisconsin–Madison, and William Smith of NASA’s Langley Research Center. Their paper focuses on the problems faced by users of broadband infrared measurements, specifically the inability to separate the effect of land surface temperature (LST) from natural variations in land surface emissivity (LSE), and how new high spectral resolution sounders help overcome this and other problems. The International TOVS Working Group (ITWG) awarded best oral and best poster presentations. Oral criteria were content, organization, delivery, and time management. Oral presentations were judged by the current ITWG Co-Chairs and two previous Co-Chairs, scientists from four different international institutions. Bob Knuteson was the only speaker in all judges’ top 3 presentations. Soumia Serrar, from LMD, France, won best poster award. The Conference was held in Sainte Adele, Canada, from October 29–November 4.
A paper on the calibration of NOAA-12’s Advanced Very High Resolution Radiometer (AVHRR) was published in the International Journal of Remote Sensing. The study used time series of desert observations to derive a post-launch correction for the NOAA-12 AVHRR. This is the first time this technique has been applied to AVHRR data from a satellite in a morning orbit. The calibration of NOAA-12 is important because its lifetime spans from 1991 to the present and offers a long and continuous data-record. Authors are A. Heidinger (NOAA, at SSEC) and J. Sullivan and N. Rao (NOAA).
Larry Sromovsky’s paper, “Radiometric errors in complex Fourier transform spectrometry,” was published in Applied Optics, vol.42, no.10, 2003, pages 1779-1787.
Education, Outreach
ONline WISCONSIN®, an electronic publication of the Wisconsin Alumni Association, featured theWisconsin Weather Stories project in October. The publication noted that the project’s focus is “to give students statewide a better understanding of how weather plays a part in our folklore, by studying common [weather-related] sayings.” In November, Wisconsin Public Radio featured the project in its Cultural History series. The piece, by Christen Kinsler, ran November 10 onMorning Edition and included a long interview with Steve Ackerman, director of CIMSS, professor in the Department of Atmospheric and Oceanic Sciences (AOS), and a project principal investigator. Reporter Steve Kuchera covered the project for The Duluth [MN] News on October 28 when folklorist Claire Schmidt (a project member) visited teacher Russ Bailey’s Northwestern Middle School classroom, helping the class practice and teaching the art of interviewing. TheWeather Stories project is a collaboration of UW–Madison Departments of AOS and Folkloreincluding through undergraduate consultants employed, the Wisconsin Arts Board, and SSEC, through its Cooperative Institute for Meteorological Satellite Studies. Principal Investigators are Steve Ackerman, Jim Leary, and Anne Pryor. Lesson plans and weather stories will be posted on the project Web site towards the end of the yearlong project.
SSEC contributed to the promotional phase of the university’s Create the Future capital campaign, an ambitious fundraiser proposing different ways for donors to contribute to maintaining the university’s “position of strength” (Wisconsin Week, October 8). SSEC’s Scott Bachmeier, Liam Gumley, and Terri Gregory assisted Pigorsch Media with parts of the promotional video they produced. Bachmeier expertly forecast times for “photogenic” clouds and Gumley provided MODIS imagery, primarily of Wisconsin, from SSEC’s direct broadcast facility. Gregory facilitated. Late in the video, the top of the Atmospheric, Oceanic and Space Sciences building is shown prominently, replete with antennas that receive weather satellite data.
Tony Wendricks, Program Coordinator for SSEC’s Ice Coring and Drilling Services, gave the October public lecture at UW Space Place. In typically engaging fashion, Wendricks spoke about his experiences in Antarctica two years ago, under the title, “Joe Lunchbox Goes to Antarctica,”giving many details of interest to nonscientists, such as the pecking order for better sleeping quarters and what’s involved in Snow School.
Honors, Awards
Charles Stearns, Professor Emeritus in UW–Madison’s Department of Atmospheric and Oceanic Sciences and a senior scientist in SSEC, will be named a Fellow of the American Meteorological Society. At January’s annual meeting, Stearns will be honored for his years of pioneering work in the study of Antarctic weather, particularly for founding the Automatic Weather Station program for Antarctica and developing the automatic weather station to better withstand the continent’s rigors. Stearns is also principal investigator for SSEC’s Antarctic Meteorological Research Program.
On Wisconsin magazine, Fall 2003, noted that the textbook, Meteorology: Understanding the Atmosphere, received the 2003 Talbot Prize for visual excellence. Meteorology, by Steve Ackerman (director, CIMSS and professor, AOS) and John Knox (scientist and lecturer; University of Georgia, Athens), was published in 2002 by Brooks/Cole.
Errata
The MODIS image of Hurricane Isabel in last month’s Top Story was acquired by direct broadcast at NASA’s Goddard Space Flight Center, and then processed by SSEC’s MODIS research team.
Thanks to Bob Aune, Ed Eloranta, and Matthew Lazzara for considerable help with their pieces; and to Tom Achtor, Steve Ackerman, Leanne Avila, Jolene Feltz, Liam Gumley, Jeff Key, Anne Pryor, Dave Santek, Chris Schmidt, Tim Schmit, Chris Velden, and Dee Wade for content.