Monthly News Summary – December 2002
Winter Starts in Wisconsin
by Terri Gregory, SSEC Public Information Coordinator
This month’s column includes news coverage and research primarily from November. Use images freely with credit to the Space Science and Engineering Center, University of Wisconsin–Madison.
Madison’s Wisconsin State Journal newspaper documented this season’s first real snow with pictures. SSEC’s Scott Lindstrom provided numbers to reporter Brenda Ingersoll. The inch-plus snowfall comes after the eighth coldest October since the late 1800s, averaging 44.8° F (49.3° is normal). November averaged 34.3°, compared to 35.5° normally. Our December 2 snowfall is nothing compared to what has fallen on the U.S. east coast, but after a cold fall, it’s welcome mostly only to skiers. Lindstrom provided a ray of hope for those of us less than enthused about a “typical” Wisconsin winter. “The outlook for December through February is warmer than normal,” he said, “so maybe we’ll have an early winter that ends early.”
Steve Ackerman does not completely believe national forecasts that a weak El Niño will keep our winter a little warmer than normal with less precipitation. His skepticism is in keeping with Wisconsin’s low temperatures and heavy snowfalls across the eastern U.S. Weather Guys Steve Ackerman and Jonathan Martin answered many interesting meteorological questions on the last Monday in November, their regularly scheduled gig on WHA Radio with host Larry Meiller. The guys discussed the string of unusual November tornadoes in the U.S. south, east and midwest. Ackerman explained how lakes freeze top down, because water becomes less dense when it freezes, so it floats. Martin explained clearly how layered clouds move in different directions because of vertical wind shear, sometimes at the top of an inversion layer. They explained why fall is so much warmer than the spring—although the earth is in the same position regarding the sun, the earth stays warm longer than it takes to get cold. Calls moved from the purely meteorological realm to questions about global warming—Wisconsin temperature records show a warming trend, how moon phase affects air temperature—it doesn’t, and the cooling effects of erupting volcanos. A representative from Audubon Society appeared to talk about annual natural events, especially those in the Weather Friend calendar.
The Weather Guys will answer all your meteorologically-related questions on Monday, December 30 at 11:45 a.m.
Agricultural Research
Runoff Study—As Wisconsin’s new non-point pollution rules take effect, UW–Madison researchers will quantify losses of phosphorus from farm fields. The College of Agricultural and Life Sciences released news of the USDA research grant in October; Wisconsin Week, the campus newspaper, noted it November 6; the Wisconsin Week Wire, on November 13. John Norman, Soil Science, leads a team of researchers including Christine Molling and George Diak from SSEC in developing a computer model, Precision Agricultural-Landscape Modeling System, or PALMS, that can be used to “provide guidance to farmers on compliance with regulations.” Researchers developed the model to predict corn growth and yield but it is flexible enough to be used for many factors, including the amount of phosphorus in a field. The model is a tool for agricultural consultants to use with farmers to make useful management decisions.
Antarctica
Shopping habits of SSEC’s Antarctic field workers made front page news in November. Mark Sabbatini of the Antarctic Sun, newsletter for the McMurdo Station U.S. Antarctic Program, featured the station’s grocery store, officially the Berg Field Center Food Room, on November 10. While he visited, shoppers were members of SSEC’s Ice Coring and Drilling Services, including engineer Jim Green (SSEC) and machinist Jay Johnson (Physical Sciences Laboratory). They were choosing supplies, about 600 pounds worth, that they’d need for their time at the South Pole drilling holes for SPRESO (the South Pole Remote Earth Science Observatory), a seismic emplacement for the U.S. Geological Survey. In a quiet location at the spin access of the earth 8 km (5 mi) from the South Pole, geologists take seismic readings as control measurements for studies of earthquakes.
SSEC’s Antarctic Meteorological Research Center (AMRC) is providing specialized NOAA satellite imagery (local area coverage) to NASA researchers in Virginia. Headquartered at Wallops Island, Virginia, researchers are working with Chilean scientists to study the Patagonian glaciers in west Antarctica. One weather forecaster sent a grateful message telling how he used the images most recently. “We used your image this morning to decide not to launch a mission to Pine Island. We also used your infrared and visible composites along with a forecast from Rothera to fly the Antarctic Peninsula. The mission was 75–80% successful. We landed at 21:45 so we will not launch another flight until Thursday morning.” The AMRC posts most imagery and data on the AMRC Web site for anyone to use.
Pinguine—Spezialisten fürs Kalte [Penguins, Cold Specialists], by Boris Culik, uses an image provided by the Antarctic Meteorological Research Center to illustrate a predicament posed by large icebergs B-15A, C-16 and C-19, primarily. They all have broken free from the Ross Ice Shelf since March 2000 and are, in combination, cutting off access to traditional breeding and feeding grounds for Adelie and Emperor penguins. Pinguine is published in Germany by BLV.
Jonathan Thom, a researcher in UW’s Automatic Weather Station program, helps collect temperature and other weather information from stations all over the continent. He also has spent months at a time “on the Ice” performing maintenance on the stations. So, when he saw the September 2002 issue of Smithsonian magazine, he knew that the caption for an aerial photograph of the Adelie Coast contained an error. In a letter to the editor, he noted, “The temperature range for Antarctica, from 32° F to -13° F, is wrong. Temperatures in Antarctica can range from around 50° F to as low as -129° F. Last year at the United States Antarctic Program’s McMurdo Station a temperature of 51° F was recorded. The lowest temperature recorded in the world occurred at Vostok Station, Antarctica and was -129.3° F.” The Smithsonianpublished part of Thom’s letter in November.
Data and Imagery
NOAA’s Daily Significant Event Imagery Report used as an Image of the Day one from the Moderate Resolution Imaging Spectroradiometer (MODIS) on a NASA earth observing satellite received at SSEC’s direct broadcast facility. Both images depict snow on western U.S. mountain tops. The November 21 image features California’s Sierra Nevada. On November 26, the focus is on the U.S. Four Corners area and Montana and Idaho. Current MODIS images from SSEC’s direct broadcast are posted on the Web.
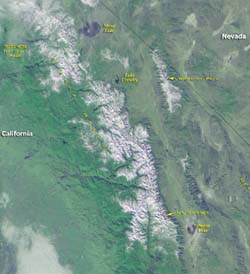 |
This small image shows the snow on California’s Sierra Nevada mountains on November 21. |
VisitView—Vesa Nietosvaara of the Finnish Meteorological Institute recently used VisitView software for a 20-person synoptic analysis course. He reports that, “for an exercise with satpics [satellite imagery] and overlay fields, it was just marvelous to work with.” He reports that this scientific software package is easily understandable, quick and really comfortable. Software programmer Tom Whittaker develops VISITView as a tool to train National Weather Service forecasters to use satellite imagery. Because of its ease of use, it has begun to be used to train meteorologists around the world.
An SSEC global satellite imagery montage will be used in Maps and the Internet, a book to be published by Elsevier Science Ltd, UK. The montage will appear in the article, “Internet Maps in Teaching,” by James Carter, who uses SSEC satellite imagery from the Web in his geography classes at Illinois State University in Normal.
Polar Science
Satellite Data Survey—Do you use satellite data in your polar research? If so, your input is needed in a survey sponsored by NSF to judge the research need for satellite data. The results of this survey will enable NSF-supported polar-satellite remote sensing activities, including those at the Arctic and Antarctic Research Center at the Scripps Institution of Oceanography, the Antarctic Meteorology Research Center at the University of Wisconsin–Madison, and the National Snow and Ice Data Center to formulate and recommend improvements to polar satellite remote sensing services for the benefit of high latitude researchers worldwide. The survey hopes to comprehensively assess how satellite data are presently used to support polar research and expeditions, and to provide recommendations for improvement. Survey creators need your input by December 31, 2002 at survey@arcane.ucsd.edu.
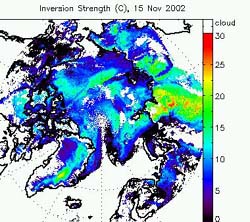
Inversions—Jeff Key (NOAA, at SSEC) and Yinghui Liu (CIMSS graduate student) are now retrieving temperature inversion information in the polar regions in near real time with MODIS data, received via direct broadcast at SSEC. The strength (temperature difference across the inversion) and height of low-level, clear sky atmospheric temperature inversions are estimated with channels on MODIS sensitive to water vapor and infrared wavelengths. Key and Liu are posting composites daily on the Web. Other real-time polar products are also available.
 |
Jeff Key spoke with A. Lam of the Daily Planet, a science news show on Canada’s Discovery Channel, about how much solar energy the polar regions reflect. The Antarctic area reflects most, with an annual average planetary albedo of more than 75%. The Arctic value is 50%, compared to the global average of about 30%. Ms. Lam also asked whether painting all the roofs in the world white would offset global warming, and by how much. Key is a polar scientist and NOAA team leader at SSEC.
Tracking Fires
The CIMSS group who uses U.S. geostationary weather satellites (GOES) to monitor agricultural burning and wildfires now provides fire products in McIDAS format to the Unidata program, managed in Boulder, Colorado. Chris Schmidt (CIMSS) and Elaine Prins (NOAA) worked with McIDAS programmer Russ Dengel to produce special fire products based on the WildFire Automated Biomass Burning Algorithm (WF-ABBA) in real time every 3 hours for dissemination to the university user community. The Unidata program enables universities to acquire and use meteorological and related data sets and is operated by the University Corporation for Atmospheric Research (UCAR). The WildFire algorithm was released this summer to be used routinely by the National Weather Service in forecasting weather conditions favorable for fires.
Elaine Prins and CIMSS’ Joleen Feltz are collaborating with J. Pereira of the Instituto Superior de Agronomia at the Universidad Tecnica de Lisboa in Lisbon, Portugal to compare methods of detecting active fires and burn scars. Preliminary mappings of burned areas based on SPOT-4 (Satellite Pour l’Observation de la Terre) vegetation data at 1 km spatial resolution appear to indicate that there are regions in Brazil where burn scars are hard to capture at 1 km resolution (scars are smaller than that). In those situations, active fires detected with the GOES Wildfire Automated Biomass Burning Algorithm (WF-ABBA) are needed to complement burned area maps. SPOT-derived burn scar maps are also being compared with higher resolution Landsat scenes. This study is providing valuable insight on the utility of combining multisensor active fire and burn scar products to correctly characterize fire regimes in South America.
Feltz, Schmidt and Prins also have provided K. Knapp (Cooperative Institute for Research in the Atmosphere) with multispectral GOES-8 data for the time period October 2000 through February 2001. Knapp will process the data with his GOES Aerosol Smoke Product (GASP) algorithm as part of a collaborative effort to study the relationship between extreme wildfire activity detected with the WF-ABBA in Argentina during the austral summer of 2000/2001 and extensive smoke transport throughout the region.
Weather Research
CIMSS has published Volume 3 of the Cooperative Institute for Meteorological Satellite Studies (CIMSS) Newsletter. This science news magazine provides recent information about CIMSS’ research and education activities. To be added to the mailing list, email editor Leanne Avila.
NASA’s Earth Observer for September/October 2002 featured reports from the MODIS Science Team Meeting, held in July. All MODIS researchers are happy with the “outstanding results” from MODIS data products from NASA’s Terra satellite. Researchers also celebrated the successful launch of Aqua, Terra’s sister satellite, in May. All three science teams reported, including the atmospheres group, composed mostly of CIMSS and NOAA scientists at SSEC. Paul Menzel, a NOAA chief scientist at SSEC, is key atmospheres researcher. These scientists are pleased with atmosphere data products from the MODIS instrument on Terra. The MODIS on Aqua is performing well and initial products look good, but software will need to be adjusted. The group concluded that “having two MODIS instruments will result in better polar wind [measurements]; improved diurnal process studies of aerosols, moisture, and clouds; and improved AIRS and MODIS observations of cloud properties and surroundings.” AIRS, the Atmospheric Infrared Sounder, provides information through the atmosphere in high vertical resolution, while the MODIS, the MODerate-resolution Imaging Spectroradiometer, provides detailed resolution horizontally. The Earth Observer also featured a MODIS image of Hurricane Isidore from SSEC’s direct broadcast facility.
A major specialty of SSEC’s CIMSS is simulating products from future NASA or NOAA satellite instruments. Recently student researcher Justin Sieglaff compared which exact regions of the electromagnetic spectrum are measured by the current GOES imaging instrument and the proposed Advanced Baseline Imager. Sieglaff has calculated spectral response functions (SRF) for both instruments and shows them graphically. He lists differences in average radiances (or the amount of energy emitted) in a cloudy area and a clear, heavily vegetated area for the current GOES Imager and the proposed instrument, which would measure a narrower band of wavelengths. He also includes a small program that allows you to plot the SRF for several different GOES Imagers.
With Tim Schmit (NOAA, at SSEC) Sieglaff also has provided an overview of all five infrared bands on the current GOES imager and links to detailed pages where it is possible to see subtle differences between each GOES SRF. As in the visible SRF page, a user can toggle between any combination of GOES-8 through GOES-12 InfraRed Spectral Response Functions.
Wayne Feltz, Derek Posselt, John Mecikalski (all of CIMSS) and Gary Wade and Tim Schmit (both with NOAA at SSEC) have submitted the paper, “12 June 2002 Rapid Water Vapor Transitions During the IHOP Field Program,” for the annual meeting of the American Meteorological Society’s Symposium on Observing and Understanding the Variability of Water in Weather and Climate. The paper highlights dramatic oscillations (1 cm) of total precipitable water observed by SSEC’s Atmospheric Emitted Radiance Interferometer (AERI) and a Global Positioning System (GPS) receiver during the International H20 Program on June 12, 2002 at the Homestead site in the Oklahoma panhandle. The researchers compared total precipitable water observations from GOES-11 and GOES-8 sounder instruments with AERI and GPS measurements showing consistent tendencies until 1100 UTC (6 a.m. U.S. Central Time), showing skill at resolving these small-scale water vapor features. The GOES sounder data smooth over the last water vapor transition, likely because of the instrument’s relatively large field of view, compared with the tight water vapor gradient detected by the AERI and GPS, both ground-based sensors that measure a much smaller area.
Geary Callan (NOAA, at SSEC) has written a computer program to catch a hanging semaphore (a file signaling a certain condition) in the process CIMSS uses to acquire data from the National Centers for Environmental Prediction. The use of a semaphore prevents concurrent running of multiple processes, but can be problematic if the computer crashes. Before using this program, human monitoring was required. At CIMSS, NCEP data is used in the generation of many satellite-derived products as well as to initialize numerical weather forecast models.
Education, Outreach
The IceCube Web site now includes information on “Astronomy in the Ice,” a professional development course that features AMANDA/IceCube and related science developed by Jim Madsen at UW–River Falls. This site includes resources for inquiry-based laboratory problems that can be used with high school students.
Students at Gallaudet University’s Model Secondary School for the deaf in Washington, D.C. were pleased to receive a presentation on Weather on Planets from SSEC planetary scientist and outreach director Sanjay Limaye, with teacher Mary Ellsworth signing. They expressed their delight with several email messages.
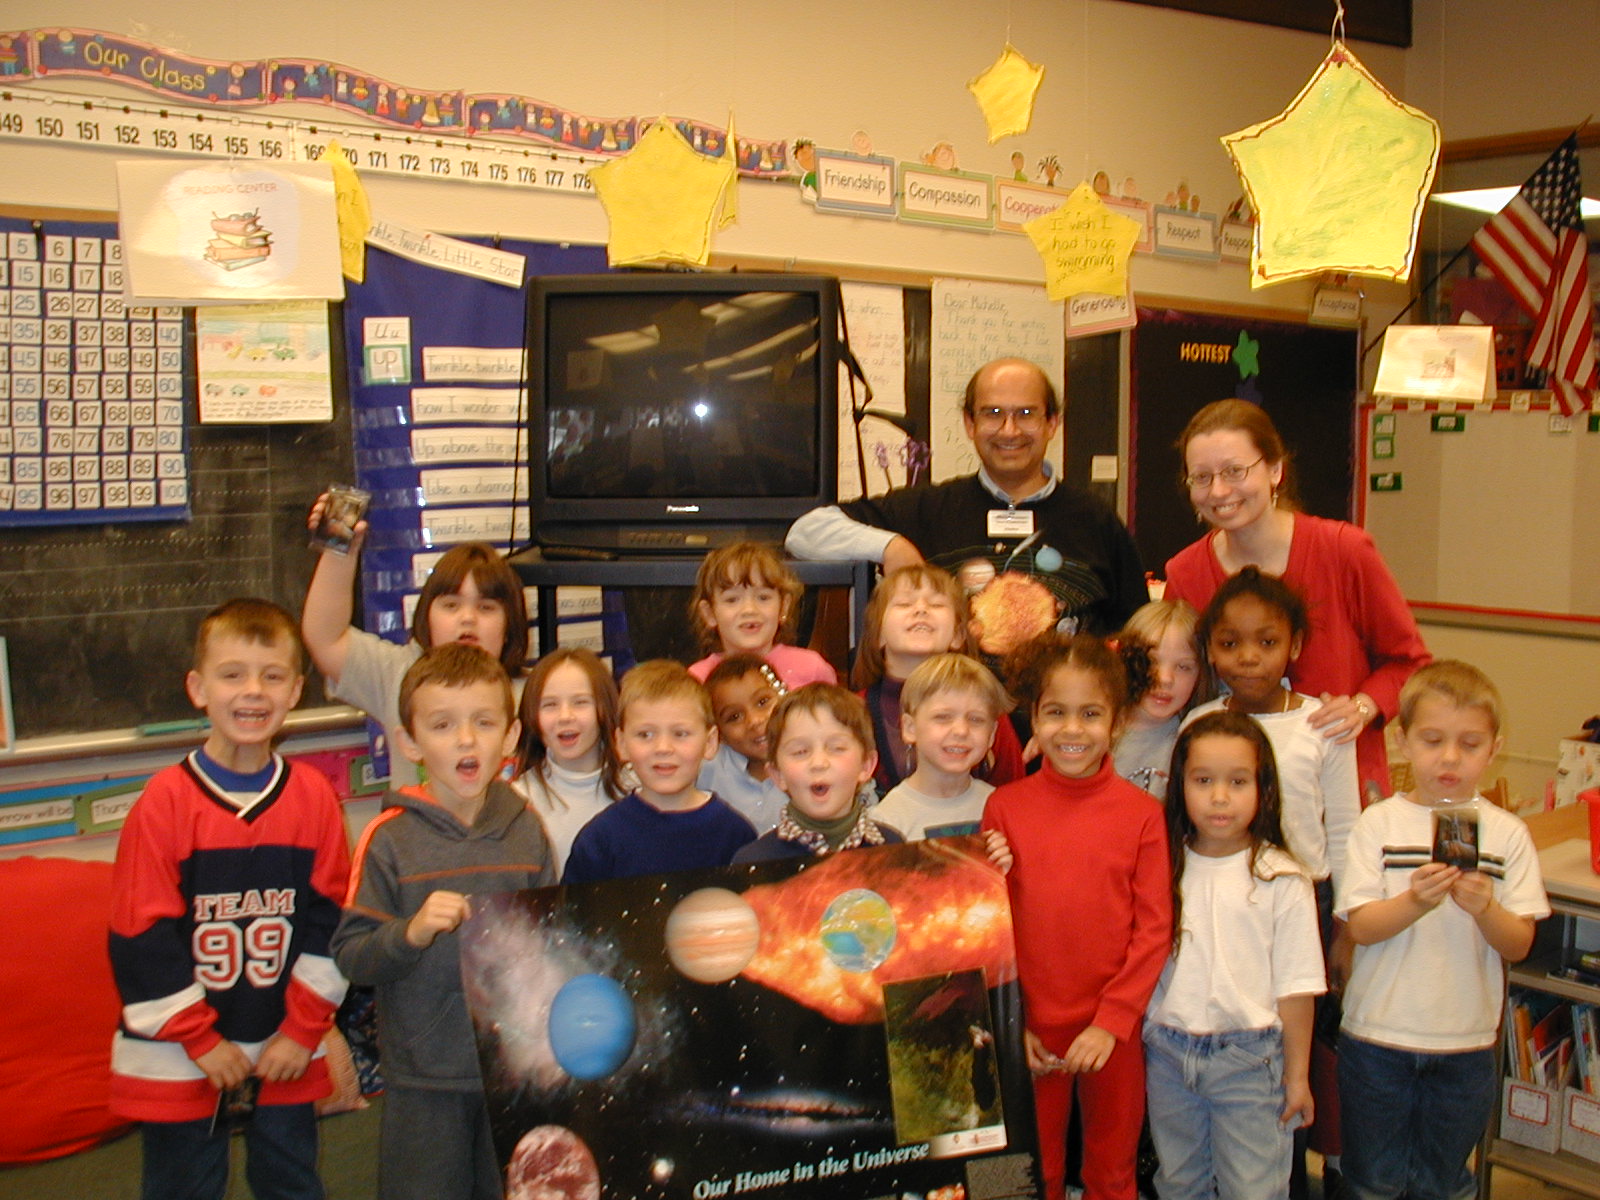
Limaye also gave talks on Planetary Meteorology at Neville Public Museum in Green Bay and to Madison’s Falk Elementary kindergarten. Appreciative kindergarteners are shown with Limaye, left and Rosalyn Pertzborn, SSEC outreach coordinator.
Honors, Awards
SPIE, the international society for optical engineers, presented SSEC senior scientistEdwin Eloranta with the Scientific Achievement Award in Remote Sensing at the Society’s recent annual meeting in Hangzhou, China. Eloranta, who leads UW-Madison’s lidar group, was honored for developing two state-of-the-art lidar instruments that enable detailed analysis of atmospheric structure. The group is completing a new version of the University of Wisconsin High Spectral Resolution Lidar for routine, untended measurement of arctic clouds and aerosols, to be placed in the ice near Barrow, Alaska. Eloranta is an acknowledged pioneer in atmospheric lidar.

Hung-Lung (Allen) Huang, SSEC senior scientist, has been appointed chair of the National Academies’ Committee on Environmental Satellite Data Utilization. According to The Space Studies Board, which oversees Huang’s committee, it will advise the government on issues of future environmental satellite data utilization, and is charged with an end-to-end review of data products from instruments launched from 2010 to 2020, with an eye toward their usefulness and positive economic impacts. Huang brings to the committee 20 years experience in most aspects of meteorological satellite data processing and applications, including developing the complex software necessary to make useful products from the data. He also models data products for proposed instruments. He has served as principal investigator for developing the International MODIS and AIRS data Processing Package, NOAA’s Advanced Baseline Imager and Sounder instruments, and the Navy’s Multiple University Research Initiative. Huang will serve until November 2004 and is assisted by SSEC’s Brian Osborne. The National Academies includes the National Academy of Science and of Engineering, the Institute of Medicine and the National Research Council. The committee reports to the Academies’ Space Studies Board.
To define or explain some terms, I used the textbook, Meteorology—Understanding the Atmosphere, by Steven A. Ackerman and John A. Knox, © 2002, Thomson-Brooks/Cole.