Monthly News Summary – September 2000
Fires and Ice
by Terri Gregory, SSEC Public Information Specialist
August/September 2000
This column covers news received in July and August.
Monitoring Fires from Space
High layers of smoke apparently from western wildfires blew over Wisconsin on August 9. Invisible to the naked eye, the elevated layers could only be seen in radar images. Scott Bachmeier in SSEC’s Cooperative Institute for Meteorological Satellite Studies (CIMSS) put them on the GOES Gallery Web site with corresponding satellite images. Earlier that day, before discovering the radar, Scott spoke to the Madison-based representative of the Appleton Post Crescent about effects of the wildfires on Wisconsin weather. It seemed there were few.
On August 14, Scott caught stunning satellite images of smoke settling in western mountain valleys and blowing away later in the day.
NOAA researcher Elaine Prins talked with WNWC radio reporter Gordon Govier about how the western wildfires might affect Wisconsin weather. In her research and that of her university collaborators Joleen Feltz and Chris Schmidt, Elaine uses GOES data to observe fires and smoke. Elaine told the reporter that thicker smoke (optically) can reduce temperature at the surface by 3–5 degrees, but that Wisconsin probably experienced much less of an impact, about 1–2 degrees cooler. It is also possible, she said, that, because forecast models do not account for smoke, surface temperature forecasts can be up to 5 degrees too high for optically thick smoke. While preliminary research findings indicate that smoke can result in reduced precipitation, it probably did not have that effect in Wisconsin.
Scott and Elaine and their colleagues continue to track wildfires and their smoke and its effects. Watch the GOES Gallery.
For more information, follow these links.
Professor H. Evangelista at the State University of Rio de Janeiro, Brazil, is using UW–Madison experimental smoke products in a black-carbon monitoring study. In the Radioecology Laboratory located on remote Ilha Grande Island, between the cities of Rio de Janeiro and São Paulo, Professor Evangelista and students observe elevated black carbon concentrations on selected days during the height of the burning season. These concentrations are thought to be associated with transport of aerosols from biomass burning in Amazonia. Professor Evangelista uses the smoke product and streamline analyses developed by researchers Elaine Prins (NOAA) and Joleen Feltz to monitor biomass burning with GOES data for the 1999 fire season.
Elaine and Chris Schmidt produced experimental products to monitor wildfires in Quebec in collaboration with M. Moreau of Environment Canada. Satellite imagery was placed on the Web in real time. This year, the wildfire product from GOES data is being compared to data from NOAA’s polar-orbiting satellite in near real time to assess the advantages and disadvantages of each instrument for fire detection and monitoring. Although the fire season in Quebec was slow this year, the wildfire product detected several fires including a small fire on June 19 which was not detected by the polar-orbiting satellite due to cloud cover at overpass times.
 |
This GOES satellite image shows Quebec province and one fire identified with the Automated Biomass Burning Algorithm. The image was taken on June 19, 2000. Click to see the original with annotation. |
The researchers also have developed a technique that uses “alpha blending” to create a composite image of three data products: multispectral GOES imagery, a 1-km resolution global land-cover-characteristics ecosystem data base derived from Advanced Very High Resolution Radiometer data, and the GOES ABBA fire product. The same product is being used to capture heat signatures and smoke plumes associated with wildfires in the Western U.S.
The fire researchers are also producing fire products for the 2000 South American fire season. Several groups of U.S. and South American scientists will use the products in fire validation studies, climate change modeling activities, and emissions modeling.
Watching Volcanos
Saskatchewan Education’s online curriculum links to SSEC’s Volcano Watch “as a valuable educational resource.” The site is multiple levels deep and many different school systems link from it. Volcano Watch is hidden in “A Curriculum Guide for the Middle Level – Grade 6 Activity” and may be elsewhere.
Research Central, a Web site operated from London, Ontario, Canada, links to SSEC’s Web site for Volcano Watch. Research Central labels itself as a “free, central starting point for anyone doing research on the Internet.” SSEC is listed under Current Events, Weather.
Drilling Ice
Latest in SSEC’s Antarctic projects is the Ice Drilling and Coring Service, mentioned in the July 30 Milwaukee Journal Sentinel. In his article, Ernie Mastroianni said that the five-year contract, managed at SSEC by Bob Paulos, “covers all National Science Foundation ice coring and drilling projects at high latitudes and high altitudes, which include polar areas such as Antarctica and Greenland and high mountain ranges.” Charles Bentley, emeritus professor in Geology and Geophysics, serves as the project’s principal investigator. SSEC has begun to receive and store ice-coring equipment. NSF has selected Ernie Mastroianni for its visiting media program to the South Pole this southern summer. He will visit SSEC and other researchers while there.
Photographing Snowflakes
The Board of Friends of UW–Madison Libraries voted a small grant to The Schwerdtfeger Library to preserve and conserve Wilson “Snowflake” Bentley’s lantern slides of snow crystals. Librarian Jean Phillips is “excited not only about their preservation but making them more accessible to our users.” In January, as part of an exhibit in several campus libraries, The Schwerdtfeger Library acquired prints and lantern slides by the first snow crystal photographer. This grant enables permanent access and preservation of the unique collection. The Friends of UW–Madison Libraries began awarding small grants through competition in 1997 and have granted nearly $75,000 to campus library units.
Tracking Icebergs
Muse, a children’s science magazine, will feature icebergs in their December issue. Matthew Lazzara worked with authors on a story that will include B-15, B-16 and all the other icebergs in the Ross Sea that Matthew has monitored since March.Muse is a joint publication of the Cricket magazine group and the Smithsonian Institution.
Weather-wise.com, an Australian weather site, reports on the Ross Sea icebergs in a long article with many facts and scientists’ suppositions, and satellite images provided by the AMRC. History is provided, showing why the Ross Ice Shelf was due to calve icebergs.
- Icebergs
- *site currently under construction*
Matthew Lazzara’s discovery of iceberg B-17 was mentioned in the Summer 2000 issue of Topics, Lyndon State College’s alumni newspaper. Matthew is a 1991 graduate of Lyndon State in Vermont. Matthew was also interviewed for the CBS syndicated radio program, The Osgood Files. The New Scientist briefly covered the iceberg story in its April issue.
Watch for the October issue of Discover magazine. Karen Wright interviewed Matthew Lazzara about the icebergs and he supplied some images. The magazine is available on news stands mid-September.
- AMRC
- Discover
- *note: because this article has since been archived, you must be a registered user of Discover.com in order to view it.*
Contributing to Polar Meteorology
In July, Links2Go selected Chuck Stearns’ Antarctic Automatic Weather Stations and the Antarctic Meteorological Research Center Web sites as “Key Resources” in polar topics. Of the 50 pages selected as Key Resources for the polar topic (key resources are those sampled most often), the AWS page ranked 39th and AMRC 40th. Links2Go “provides online businesses and end-users with search and directory services.” The heart of their business is a large topical directory of the Internet.
The AMRC is listed in Web Resources in Peter Guest’s Polar Meteorology modules, on the Naval Postgraduate School’s Web site. Peter especially likes the composite satellite imagery.
On SAFARI
SSEC’s Dan LaPorte and Hank Revercomb made the Johannesburg, South Africa’sSunday Independent for August 20. A photo of the pair was featured in a long article about the Southern African Regional Science Initiative field experiment, SAFARI 2000, now underway. SSEC’s Scanning-High resolution Interferometer Sounder, its crew and SSEC researchers are taking measurements from NASA’s high altitude research aircraft, the ER-2. The measurements over the southern African landscape will be compared with instruments on NASA’s earth observing satellite Terra. NASA and its collaborators hope that SAFARI measurements taken during the southern African dry season will “improve the ability of new instruments on Terra to monitor active fires, map ‘burn scars’ eft after the fires, and measure the amount of carbon monoxide in the lower atmosphere.”
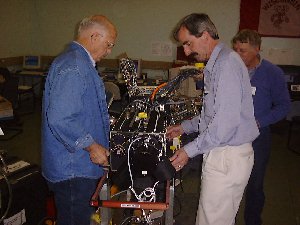 |
Dan LaPorte, Hank Revercomb and Ralph Dedecker (in back) ready the Scanning-HIS for the ER-2 on site in southern Africa during SAFARI. |
SSEC director and Scanning-HIS principal investigator Hank Revercomb explained Africa’s climate: “The African land mass is a giant gyre in its circulation. With a perpetual high over the continent, smoke from power plants and brush and farm fires can’t escape. The Scanning-HIS and measurements from the other instruments will help us learn how to detect smoke and accompanying carbon monoxide signatures.” SSEC is looking particularly at the MODerate-resolution Imaging Spectrometer (MODIS), an instrument SSEC helped develop, and the Canadian instrument, Measurements Of Pollution In The Troposphere. As its name implies, MOPITT measures carbon monoxide and methane in the troposphere. The research teams of MOPITT principal investigator James Drummond, University of Toronto, and Hank Revercomb will compare different techniques to detect trace gases, including carbon monoxide.
The Radome on the Roof, or, What’s an X-band, Anyway?
Through the new X-band antenna on its roof, SSEC will provide satellite images and scientific products to the research community for a broad range of projects, particularly for studying global change. Briefly, the Moderate Resolution Imaging Spectroradiometer (MODIS) is a key instrument on polar-orbiting earth-science satellites in NASA’s Earth Observing System. Terra is the first satellite in that series, launched in December 1999. SSEC researchers helped develop MODIS and the software that makes its data useful. MODIS monitors cloud cover and cloud-top properties in many different channels, or wavelengths, that look at light in different ways. By combining channels or viewing them separately, researchers can see many different properties of clouds that can be examined for trends in regional and even global weather.
UW–Madison’s Communications Office released news of the MODIS antenna on August 2; the antenna was raised by helicopter very early (7:00 a.m.) on August 5. Madison’s WIBA radio mentioned the antenna lift. Sevie Kenyon of NetAgra Knowledge Services pointed his email list (Stoughton FFA) to the release and to other weather information on the SSEC Web site. SSEC has posted the first full image, horizon to horizon, that the antenna has received. More will follow when calibration and other issues are resolved in a normal checkout period.
The antenna under the new radome on the top of SSEC’s roof is referred to as an X-band antenna. This is the frequency used to receive the signal from the polar-orbiting satellite (Terra) as it travels from horizon to horizon over Madison. With this antenna we can pick up a swath of data from farther north than Hudson Bay, Canada to the Yucatan Peninsula south of Mexico. The X-band is simply that portion of the electromagnetic spectrum, or band, used to transmit certain information. The X-band is usually used for radar and often for deepspace communication. The X-band frequency ranges from about 8–12.5 GHz. Wavelengths in that range are from 2.4–3.75 cm wide and are called microwaves, at the short end of that part of the spectrum classified as radio waves. SSEC’s antenna only receives the microwave signal; it does not send. It receives data and images from the MODIS instrument only.
Besides helping to develop the MODIS instrument and software, SSEC researchers are also using MODIS data to study weather phenomena. Some examples can be seen in the GOES Gallery.
Research News
To make satellite data more useful for weather forecasters, researchers often “correct” the data with software. Recently, such a correction was added to the suite of data processing software for the sounder instrument on the GOES-11 satellite to handle “sun glint.” At certain times and locations there is additional specular reflected solar radiation in the satellite’s sounder data due to the geometry of sun and satellite. Tony Schreiner (SSEC) and Tim Schmit (NOAA) provided this software modification to NOAA’s Forecasts Product and Development Team.
 |
Of these two images from the GOES-11 sounder instrument, the upper uncorrected image shows cloud (orange) where there is none. The lower image is corrected. Click on this image to see a four-panel picture showing the visible image, upper right, which shows the clear, sun glint area to the right of the image. The lower left image is from GOES-8, which looks at the earth from a different viewing angle, so does not falsely show cloud in the sun glint area. |
Researchers Jun Li (CIMSS) and Tim Schmit (NOAA) calculated weighting functions for the same atmospheric profile (column of air) for both current and future geostationary sounders. A high spectral resolution advanced sounder will have more and sharper weighting functions compared to the current GOES sounder. This leads to retrievals with better vertical resolution. A weighting function depicts the layer of the atmosphere where radiation originated for a given band.
 |
Atmospheric profile from a proposed advanced sounder instrument. Click for a larger image showing a comparison with the current sounder. |
For More Information
Researcher Jeff Key (NOAA) has produced a 40-year climatology of cyclonic systems at 1000 mb and 500 mb levels. Cyclones were identified with an automated procedure using geopotential height fields from the National Centers for Environmental Prediction and the National Center for Atmospheric Research. The data set consists of cyclone locations and tracks over the 40-year period. This data has been used to analyze trends and can also be used to formulate climatologies of cyclone frequencies, cyclogenesis, and storm tracks.
UW Communications
For More Information
Wilt Sanders, a senior scientist in both SSEC and the Physics Department, hopes to raise the profile of academic staff as the new chair of the Academic Staff Executive Committee. After starting in the Academic Staff Assembly in 1987, Wilt served twice on ASEC. Wilt is profiled in the August 30 issue of both print and online versions of Wisconsin Week. The Academic Staff Assembly is the campus body that represents university employees who are not “classified” civil servants nor faculty. Academic staff perform such disparate and essential duties as scientific research, nursing, public and media relations, editing, directing labs and other units, and managing programs.UW–Madison Tips
*we’re sorry, but this site is no longer available* UW–Madison’s Communications Office included SSEC’s hurricane research in its first Tip Sheet to hit the Web. Ascribe, “The Public Interest Newswire,” posted it on July 3. Chris Velden is quoted from a piece in Space.com on how computer models and technology continue to improve, aiding hurricane forecasters.
Open House events in the Atmospheric, Oceanic and Space Sciences Building were noted in the UW–Madison release promoting the Campus Open House. Tim Kelley suggested that visitors “take a look at Antarctic weather from a satellite, or learn about past and future climates.” In the Saturday events summary, weather and space science exhibits were listed.
UW–Madison’s Office of Visitor Services sent out their own release to faculty and staff, and, of all the exciting campus events they chose to note, there was, “see the latest technology in the Atmospheric, Oceanic and Space Sciences.” Many AO&SS events were listed in the Open House Schedule.
CIRRUS is covered in “While You Were Away,” Wisconsin Week’s column of summer happenings. The column appears only in the first issue of the new semester. CIRRUS, Cloud Infrared Radiometer for University Earth System Science, is one of five projects NASA selected in a preliminary competition to develop some of the first scientific payloads for the orbiting space station. Steve Ackerman, CIMSS director, is the study’s principal investigator and promises to involve students in every stage of the project should it be funded.
On the Net
For More Information
Pine Lake Tornado
*we’re sorry, but this site is no longer available*
Scott Bachmeier, Jim Nelson (both of SSEC) and Gary Wade (NOAA) provided imagery showing weather during and before several tornado outbreaks including a fatal tornado striking Pine Lake, Alberta on July 14. The GOES Gallery showed imagery from geostationary (GOES) and polar-orbiting (NOAA-12 AVHRR) satellites. An Enhanced-V cloud top signature was evident in the GOES 10.7 micron infrared imagery 90 minutes before the tornado struck.
RMS Titanic, Inc., the only group licensed to conduct research and recovery expeditions to the Titanic wreck site, used SSEC satellite imagery to show weather conditions for their most recent expedition. From the home page, click on Expeditions and then on The Weather. The current expedition to the Titanic was cut short on August 11 by Hurricane Alberto. Although the expeditionary ship Keldysh was equipped with the latest weather information gathering gear, a U.S. Navy helicopter stopped by to remind them to leave. And they did, expeditiously.
Because of increased traffic to its site during the hurricane season, NOAA’s Satellite Services Division lists SSEC’s GOES-8 imagery as an alternate source of information.
*site currently under construction*
Weather-wise.com used an animation by the Tropical Cyclones group in its August 2 story on Tropical Storm Daniel. The storm threatened the Hawaiian islands and the Kenwood Cup. It threatened the sailing race with lack of wind!
Norbert Ueberuck, a Web provider in the Dominican Republic, praised the Tropical Cyclones group: “As Hurricane Georges in 1998 hit us very hard, without receiving early warning from the local news channels, since 1998 I only trust you guys, and you did not fail yet.”
Former Tropical Cyclones group member Jason Dunion is now with NOAA’s Hurricane Research Division. He recently thanked the group for wind measurements they provide during hurricane season. Jason generated his own surface map showing different sources of wind measurements.
 |
Jason’s wind measurement map. The colors represent: adjusted Air Force reconnaisance surface wind measurements (dark blue); adjusted surface visible satellite wind measurements (red); buoys (gold); ships (light blue). |
Staff Sergeant Brian Sellers is stationed on Kadena Air Base, Okinawa and has relatives on the U.S. east coast. During hurricane and typhoon season, he wants to track storms in both Atlantic and Pacific oceans. He says that the Tropical Cyclone site is “the ‘go to’ place—a clear, concise site that quickly provides all the information I could hope for on any tropical activity.”
Broadcast
Weather Guys Jonathan Martin and Steve Ackerman fielded a variety of questions from WHA radio’s call-in audience on July 31 covering lightning, rain, clouds, hurricanes, and heavy winds. Larry Meiller started his show with a discussion of lightning research presented in the New York Times in July. Listeners lined up on the phone lines to talk to our weather experts. Weather Guy Steve Ackerman stood in alone on August 28 for a lively program primarily about lightning and severe weather. Listeners also learned that meteorology does not mean the study of meteors, but rather, study of the atmosphere.
For More Information
After seeing imagery on the GOES Gallery, KELO-TV’s Jay Trobec asked Scott Bachmeier “for a few more GOES-11 images.” Scott had shown imagery from a tornado event that affected their viewing area, Sioux Falls and Rapids City, SD, on July 11. Jay, KELO’s meteorologist, used the images on the July 17 newscast at 5 p.m.
The BBC interviewed Chris Velden for a radio piece on the super typhoon that struck Taiwan in late August.
Sanjay Limaye appeared on WORT-FM on Scott Delaruelle’s August 3 science show. Sanjay and Jim Lattis, Space Place director, discussed exploration of Mars and space in general.
In Print
For More Information
The Unidata program profiled Bob Fox in the Summer/Fall issue of its newsletter. Bob retired as SSEC’s executive director in July, and finished his 14 years on the Unidata Policy Committee. For 7 of those, Bob chaired the committee. As Unidata’s Jo Hansen said, “Bob was the major player in helping Unidata utilize the downlinking and data processing services at SSEC to generate data streams of value in university education research.” At the dinner in his honor, Bob was also commended for “his generosity, compassion, and fundamental decency.”
In June, John Young and Scott Lindstrom reported on Wisconsin’s record-breaking rainfall. Scott’s statistics were used in an article in the Milwaukee Journal Sentinelfor June 15. Scott used records from Madison’s airport, which showed that “15.27 inches of rain fell in the 30 days ending at midnight Wednesday [June 14], making that the wettest 30-day period in the last 50 years.” The article focused on the havoc wreaked in Dane County and southern Wisconsin.
David Medaris of Isthmus, Madison’s weekly newspaper, wrote a lively and informative piece for the July 21 issue. David used those same statistics and reminded readers that the State Climatologist’s Office serves up all sorts of weather records, just like those that Scott used.
The journal Polar Geography will include a note and pictures on the recent Ross Ice Shelf calvings. The Antarctic Meteorological Research Center provided the editor with satellite images of all the new (since March) icebergs.
Once again SSEC is listed in Launchspace magazine’s annual directory. The magazine’s Dec./Jan. edition is a directory of the “global satellite and space marketplace.”
Weatherwise magazine for July/August features the weather forecasting team at Johnson Spaceflight Center. This branch of the National Weather Service forecasts weather conditions surrounding Space Shuttle launches and landings. The group uses their own version of McIDAS, developed at SSEC.
Outreach and Honors
For More Information
Thanks to NOAA and UW–Madison researchers collaborating at the Cooperative Institute for Meteorological Satellite Studies, teachers and students can now receive products from the GOES sounding instrument. Through the Unidata program, university researchers and educators can acquire and use atmospheric and related data on their own computers in class and in projects. Gary Wade (NOAA) and his federal and university colleagues made GOES products available in early July to the Unidata community; products include sounder-derived product imagery of total precipitable water and ozone, atmospheric stability (lifted index and convective available potential energy) and sea surface temperature, derived from cloud-top pressure and imager data. UW–Madison and NOAA hope to gain feedback on the utility of GOES derived products from a wider segment of the weather science community. The National Science Foundation funds the Unidata program, which is maintained by the University Corporation for Atmospheric Research.
Shane Mayor’s poster presenting UW–Madison’s lidar research was pronounced best student poster, out of about 40 posters at the 14th Symposium on Boundary Layers and Turbulence, held recently in Aspen, Colorado. The poster is displayed on the 9th floor of the Atmospheric, Oceanic and Space Sciences building. Other poster authors are Greg Tripoli (AOS) and Ed Eloranta (SSEC & AOS).