Space Science and Engineering–Highlights 2001
by Terri Gregory and many others
Thanks to all SSEC and ASPT employees who provided highlights of their work.
Acronyms are listed at the end
Auspicious Beginnings
 GIFTS-IOMI, with SSEC playing a key role, successfully conducted its Preliminary Design Review and negotiated Navy and NOAA partnerships that have brought it to the imminent start of the Implementation Phase with launch scheduled for 2005!
IceCube, proposed square kilometer neutron observatory, was funded for $15 million startup funds. Leadership was established for SSEC’s Antarctic Astronomy and Astrophysics Research Institute (A3RI)—Astronomy’s Jay Gallagher as director and Bob Paulos the executive director.
MACO, or Mars Atmospheric Constellation Observatory (JPL collaboration), proposing a network of microsatellites around Mars to “characterize the 3-D structure of the Martian atmosphere,” was chosen as a concept study.
MODIS direct broadcast data is served as McIDAS area files to all McIDAS users.
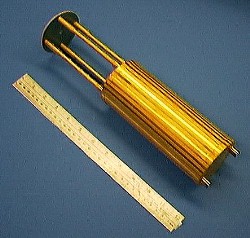
The ADR salt pill after assembly of the can, just prior to salt growth.
NASA approved the Astro-E2 mission on which the SSEC-built Adiabatic Demagnetization Refrigerator, the “coldest known object in space,” will cool the XRS instrument. (More in February In the News)
Momentous Occasions
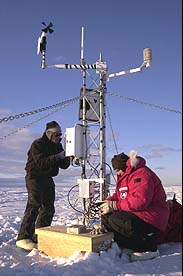
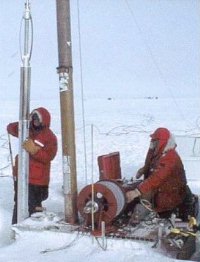
Jonathan Thom (SSEC) works with Douglas MacAyeal (University of Chicago) to put a weather station on iceberg B-15.
Automatic Weather Stations and GPS equipment were placed on B-15, the monster iceberg SSEC monitored since its birth in March 2000.
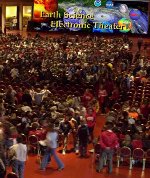
Buses drove through the Monona
Terrace to deliver 2000 students.
Chris Velden and SSEC (including CIMSS) staff organized AMS 11th Conference on Satellite Meteorology and Oceanography at the Monona Terrace Community and Convention Center.
- New format allowed more than a half hour for each overview speaker.
- Leading satellite, meteorology and oceanography experts gave wide-ranging presentations to nearly 300 researchers.
- Scott Gudes, acting head of NOAA, used several slides created by the ASPT in his keynote address.
- CIMSS and ASPT scientists presented more than 40 posters.
- Fritz Hasler gave the Electronic Theater to 2000 students and 200 more adults at Monona Terrace.
Left: Jim Butler, NOAA/CDML
Right: Tony Wendricks, Univ. Wisconsin
ICDS captured 100-year-old air for NOAA’s Climate Monitoring and Diagnostics Laboratory, was featured in Ripley’s Believe It or Not.
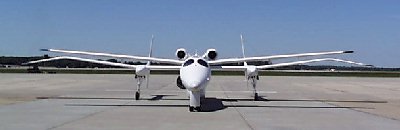
Proteus aircraft visited in July to fetch the NASA/Langley NAST-I instrument tested here before the CLAMS field campaign.
Dan De Slover testing NASA’s NAST-I with SSEC’s AERI, on the front lawn of SSEC.
SDI (SSEC Desktop Ingestor) card number 100 was built in September, in the fourth year making this satellite ingest system.
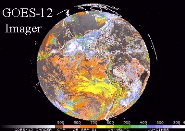
SSEC was first to ingest the first GOES-12 image and display it on the Web.
WIYN Observatory celebrates fifth year of operations in October, with SSEC designed and built control system.
Technological Advances
6 year comparison of the GOES-8 ABBA fire product with Brazil’s product that uses NOAA AVHRR data highlighted the need for a combined sensor fire detection method.
 18 AERIs now operate around the world for research and forecasting.
Ability to ingest, serve and display NOAAPORT’s NEXRAD data was added to McIDAS.
Added lots of enhancements to VISITView—overlays, audio/annotation recording, etc.
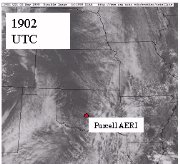 AERI continued to show its usefulness in severe weather forecasting.
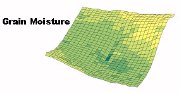
Grain moisture in a field.
Agricultural model, PALMS, was developed to track and forecast soil moisture.
AMANDA detected a neutrino, proving that the technology works. (Nature, 22 March).
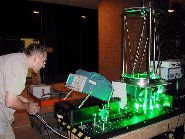
Lidar optical engineer Igor Razenkov with new lidar.
Arctic High Spectral Resolution Lidar is produced for Alaska’s North Slope.
Surface temperatures
AVHRR Polar Pathfinder cloud detection algorithm was revised and delivered to U.Colorado.
Data Center added NEXRAD radar data and data from China’s polar-orbiting and geostationary satellites (FY2B and FY1C), the US polar-orbiting satellite NOAA-16, and GOES-12.
For VisAD
- added Python interfaces
- created two tutorials, Python and Data Model
- added the ability to read text files
- added HersheyFonts, giving the ability to overlay drawing on images in “2D” mode and faster font rendering, and all the WMO weather symbols
McIDAS-Lite [sic] was produced for browsing satellite data, both local and remote.
McIDAS was upgraded to version 7.8 in May.
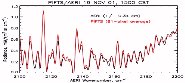 PIFTS measurements showed good agreement with those from AERI.
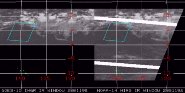
Scanning HIS, our high spectral resolution aircraft instrument, is playing a key role in the validation of satellite data from NASA Terra and GOES; a busy future is expected in keeping up with forthcoming U.S. weather and earth science satellites.
Partial methane map
The Scanning-HIS helped confirm that methane levels were back to normal over Hutchinson, KS, demonstrating a new capability.
Viewing the Earth
GOES-9 was removed from storage. Only SSEC received data, made images.
Milwaukee Journal Sentinel used SSEC’s vast data archives to illustrate historical events with images from space.
Cleveland Volcano, via MODIS
MODIS images showed the ash plume of the Cleveland Volcano on Chuginadak Island in Alaska’s Aleutian Islands, utilizing the infrared to more clearly delineate smoke from cloud.
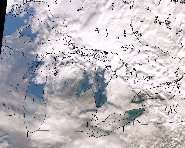
MODIS Great Lakes image, 9 January 2002
New Web page serves images from SSEC’s Terra MODIS direct broadcast antenna.
New geostationary satellite browser provides imagery for five geostationary satellites with animation and zoom capability.
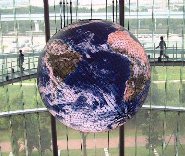 We provided special global imagery and other products to Japan’s new National Museum of Emerging Science and Innovation for display in real time on their 6 meter globe suspended from the ceiling and covered with millions of LEDs.
Research Progress
January 1990-1995
12-year climatology shows that cloud cover has fallen slightly in the cold spots of Asia and North America in the last four years. While this change in cloud cover cast doubt on the theory that aircraft contrails increase cloud cover, the decrease appears to have been accompanied by warmer temperatures in the last four winters.
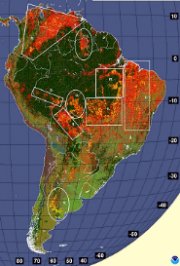 2001 fire season statistics showed increased, but below average, burning in South America.
ABBA fire products are being used to study land-use and land-cover change and carbon dynamics in Western Amazonia.
AFWEX observations of upper tropospheric water vapor show an unexpected level of agreement, but significant effort will be required to reduce uncertainty to the goal of better than 10% of the uppermost 0.1 mm.
AMSU data better resolved the thermal signature of Hurricane Floyd’s core than did a numerical model analysis from the National Centers for Environmental Prediction (NCEP) Eta model.
 Arctic and Antarctic satellite-derived winds were produced for the European Centre for Medium Range Weather Forecasting (ECMWF), NASA’s Data Assimilation Office, and the U.S. Navy.
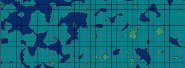
ATOVS data processed by CIMSS IAPP software. Humidity fields for morning orbits on November 30, 2001. Click for a comparison—The IAPP (CIMSS) field appears on the left and ICI (Meteo France) field is on the right.
ATOVS data from the NOAA-16 polar orbiting satellite were simultaneously processed by software produced by CIMSS and by Meteo France, to validate both systems.
Automatic Weather Station measurements are used in real-time at SSEC.
Beta version of radiative transfer model Streamer was released, for satellite radiance simulations and calculation of radiative fluxes and heating rates.
Both ABBA and Wildfire ABBA observations were used to intercompare with MOPITT carbon monoxide measurements.
 CIMSS and NOAA’s ASPT participated in GOES-12 prelaunch activities and performed the GOES-12 science test.
- They investigated the quality of GOES-12 data,
- produced products from the GOES-12 data stream,
- compared products to those from other satellites,
- investigated the impact of new bands and lost ones on both current and new Imager products,
- posted hourly displays of all 19 Sounder channels,
- produced many other important test results.
CIMSS researchers found that combining radiometric and geometric information yields improved tropospheric temperature and moisture profiles when compared to those inferred from either system alone.

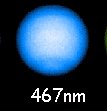
Jupiter in a wavelength enabling clouds deep in the atmosphere to be seen
Cloud structure was deduced for Jupiter, consistent with observations by Galileo probe and HST methane-band. Click on the small image for a pair of images. The left image of the pair was taken in a wavelength allowing only the top of the atmosphere to be seen.
Cloudtop pressure product
Cloud Top Pressure product was found to improve forecasts when used in the Eta model.
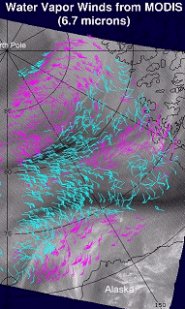
Wind measurements from MODIS data over the Arctic
Computer code, originally written to derive wind measurements from geostationary weather satellite data, has been modified for MODIS data mapped to a polar stereographic projection.
Correlations between aerosol optical thickness measurements derived from the Aeronet sun photometer network and those derived from GOES-8 varied from 0.82 to 0.93 for values below 1.5, in South America. (More in February In the News)
Coupled with a 65 kt ship observation, the Tropical Cyclones group’s AMSU data provided the catalyst for NHC to begin issuing hurricane advisories on newly formed Hurricane Noel.
Cumulative fire composite generation is increased from every 3 hours to every half hour, using WF ABBA.
Longwave measurements. Click for comparison.
Experimental retrievals including the effects of surface emissivity were compared to retrievals using the routine GOES algorithm, resulting in slight improvement and showing that it is important to account for surface attributes. (More in next month’s In the News)
For the post-launch validation of AIRS advanced temperature and water vapor sounding capabilities, SSEC is now prepared to derive a “best estimate” atmospheric state over the ARM site in Oklahoma.
 Full disk image of cloud-top pressure was produced from new GOES-12 Imager data.
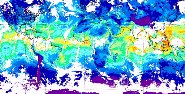
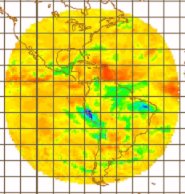
Total precipitable water derived from MODIS data.
Global precipitable water product will give continuous measurements over the series of NASA earth science satellites, starting with the MODIS instrument on Terra. (More in February In the News.)
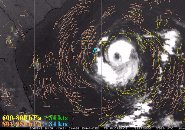
Winds at night around Tropical Storm Florence
GOES 3.9 micron channel was used to derive nighttime low-level wind fields, improved coverage by about 50% with similar accuracy.
Upper Tropospheric wind measurements, 2002 GWINDEX.
GOES WINDs EXperiment produced wind measurements from GOES-10 “rapid-scan” imagery. (Note: the link is to the current, second GWINDEX.)
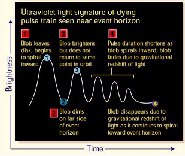
1992 HSP data produces black hole evidence.
HSP data was used to deduce existence of a black hole.
ICDS performed strongly in Critical Design Review of hot water drill that needs to drill down about a mile.
Intercalibration code was written and tested for NOAA’s High Resolution Infrared Radiation Sounder (HIRS) for potential operational use.
MODIS is shown to be better than GOES at viewing fog and stratus.
Click for more Neptune images.
New circulation features on Neptune discovered and clouds characterized.
Winds derived from TS Barry, 4 August.
NHC acknowledged experimental wind measurements made during Tropical Storm Barry as an impressive aid for wind analyses and advisories.
NOAA now routinely uses the CIMSS algorithm that retrieves sea surface temperature information from weather satellite data. Information is generated hourly over an area from 60º N to 45º S and from 180º to 30º, or most of Atlantic and Pacific Oceans.
Brightness temperature information from cloud data
On short notice, the GOES-8/10 Imager Clear-Sky (average) brightness temperature experimental product was developed for global numerical modelers (NCEP and ECMWF).
Recharacterized shortwave optical properties of various ice particle “habits” for use in a radiative transfer model.
Summary graphics outlined the impact of the VIIRS high resolution 11 micron channel on sub-pixel fire characterization.
Tropical Cyclones group makes quality controlled global wind data sets from all geostationary satellites available every 3 hours via ADDE.
Used GOES brightness temperature (surface radiation) measurements in novel data comparisons.
Comparison for snow
Used GOES Sounder data to identify snow during the day.
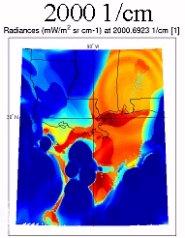
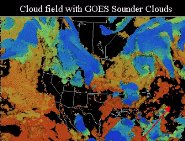
Using a modified technique for identifying low clouds from GOES Sounder data, a scheme for correctly identifying low level maritime clouds along the eastern Pacific was developed; the technique was incorporated into operational NESDIS processing.
Version 3.2 of the Cloud and Surface Parameter Retrieval (CASPR) system is released to analyze polar AVHRR data.
Hurricane Keith in 3-D
VisAD is being used to produce 3-dimensional visualizations of satellite winds, in both static displays and animations.
Example of GIFTS data cube.
Click for more.
We’re simulating data from and giving input for 12 GOES instruments (current or planned) including
- ABS simulations show that retrievals would be significantly better than GOES-8’s.
- Both ABS and GIFTS will meet National Weather Service requirements.
- With NASA, CIMSS and NOAA/ASPT are using MODIS data to simulate imagery from the future Advanced Baseline Imager (ABI) and from the GOES-I/M imager to show improved capabilities in detecting combined ice, snow and clouds and other phenomena.
Wildfire ABBA imagery is produced routinely for entire western hemisphere.
WF ABBA was used to track volcano eruptions, the Viejas wildfire near San Diego, Washington State wildfires.
Wisconsin provided more than 90% of figures in the GOES-11 Post-Launch Test (NOAA Technical) report. Sounder data and products were shown to be improved over those from GOES-8.
With WF ABBA, half-hourly fire-mask GOES images are served in near real time to NOAA’s National Severe Storms Laboratory and the Storm Prediction Center via anonymous FTP, in McIDAS format for fire-weather emergency management.
 With more rigorous surface emissivity measurements, Eta-model forecasts improved when GOES sounder data are used.
Infrastructure
Bill Bellon was named first full-time (almost) SSEC Webmaster; he and committee redesigned top Web pages, public in January.
New high-speed network for SSEC’s more than 400 computers—rewired, rerouted, redone, all by SSEC staff.
TC made leadership transition smoothly, added “new” employee (graduated student hourly).
TC resolved 4,153 help requests (tracked) and at least as many walk-ins and phone calls (not tracked).
Sharing Information
195 SSEC publications-books, reports, journal articles, conference papers, chapters in books. …
Almost 60 GB of GOES data provided to .edu domains, almost 5000 images.
Background given
- on icebergs to the New York Times, the National Geographic, and the Discovery Channel.
- on weather forecasting constraints, for the Capital Times and a Rockford, Illinois paper
CIMSS newsmagazine revived, revamped, and republished—Vol.2 out in December!
Data Center’s paying customers included
- daily real-time products for Express Technologies, Tokyo’s Science museum (remove if elsewhere), Japan’s Digital Weather Corp
- real-time satellite data for Lockheed Martin and World Effects, for a 6m globe
- a year of all GOES sounder data for Eumetsat research
- data for The History Channel’s This Week in History, Philipps-University of Marburg Germany, Sony
- special fire products for the University of Kansas
Hurricane images and data provided for Jim Carrier’s book, The Ship and the Storm, and for a UCAR brochure on natural hazards.
International Journal of Solar System Studies (Feb.2001) published three papers on the imaging of Neptune and its moon Triton, culmination of five years of observing Neptune atmospheric conditions with ground-based telescopes and the Hubble Space Telescope.
NOAA scientist Susan Solomon used data from the Automatic Weather Stations in her book, The Coldest March,to compare current and past Antarctic weather conditions.
Paper published by National Weather Association introduced the GOES-12 imager.
Practical IDL Programming, by SSEC programmer and MODIS imaging team member Liam Gumley, published by Morgan Kaufmann’s High Performance Computing division.
Satellite retrievals of cloud properties were provided to Canada’s Meteorological Service to compare with aircraft measurements during Canada’s Alliance Icing Research Study (1999-2000).
Several SSEC MODIS broadcast images on NASA’s Earth Observatory Web site.
VISITview was presented at the NOAA Tech 2002 conference.
Weather Flight Commander at Scott Air Force Base, Illinois used experimental GOES Sounder Cloud Top Pressure product to determine if a tanker mission will have clouds at flight level in the aerial refueling track.
We worked with the National Zoo’s Amazon division to integrate GOES Biomass Burning Monitoring information into an online Geographic Information System.
Innovative Collaborations
Annual McIDAS Users’ Group Meeting followed AMS satellite meteorology conference for visitors flying in from afar.
CIRRUS Phase A study brought numerous UW–Madison departments and other collaborators together in effort designed to include students in all phases of research project.
Collaboration with Quebec’s Environment Canada Meteorological Services showed the valuable application of geostationary satellite data in initial detection and ongoing monitoring of wildfires in remote locations.
Harvard University used real-time satellite data to support a field experiment in India.
In the DOE ARM Water Vapor IOPs, our 5-year effort to reduce the large uncertainty in lower tropospheric water vapor measurements to < 2% showed promise for soon achieving the goal.
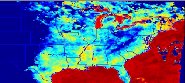
MODIS image of southeastern U.S. on SeaSpace Corporation’s 2001 calendar was made with SeaSpace TeraScan software integrated with SSEC’s IMAPP software.
Scanning-HIS and AERI accompanied the NAST-I to support the larger CLAMS objectives. We also tested the NAST-I with our instruments here at SSEC.
UC-Davis’ Department of Radiology used stereo GOES-8 and GOES-10 images (colorized globes) to train radiologists viewing the brain on real-world stereo images.
Vis5D development continued outside SSEC,
- at NOAA Forecast Systems Lab’s D3D
- in MIT and NCAR project
- at Argonne’s Cave5D
We helped Central America acquire weather satellite data in Costa Rica.
We participated in the Texas MODIS Experiment 2001, March 14 to April 4 to improve MODIS calibration.
In the Limelight
AMANDA was featured in New York Times
B-15, IceCube and Amanda were featured in National Geographic (December 2001)
Both AWS program and IceCube featured in Wisconsin Week articles. (Dec.2001)
Chris “Professor” Velden on UW-Madison half time video.
Earth Observatory Web site featured Verner Suomi in the series “On the Shoulders of Giants.”
Holiday lights once more adorned SSEC GOES antennas.
MODIS imagery showed flooding on CNN.
Neptune image was used in National Geographic’s book, Exploring the Solar System.
OSSE poster featured Earth in many guises.
SGI Web site, July 10, used several Vis5D images in a lead story on weather and climate research.
The Schwerdtfeger Library was featured in Libraries, a magazine published by Friends of the UW-Madison Libraries, for the library’s collection of lantern slides of Wilson “Snowflake” Bentley’s original photomicrographs.
Weather prediction was featured on Earthwatch Radio, January 25.
Education and Outreach
Amazing new applets for Why Files, especially the really cool “how far away is the thunderstorm” applet.
CIRRUS appeared on Why Files Web site with an interactive piece on snow and clouds.
For the sixth year, SSEC hosted student apprentices brought to UW–Madison through NASA’s Summer High School Apprenticeship Research Program, on Mars-related projects and on GOES applications.
For UW–Madison’s annual road show, Sanjay Limaye spoke at Chicago’s Adler Planetarium and worked with local students.
OSSE participated for the second year in UW–Madison’s PEOPLE summer program.
Sanjay appeared with Jim Lattis (SAL) on WORT-FM science show.
Six Wisconsin high school seniors were named fourth set of Suomi scholars.
Steve Ackerman spoke about CIRRUS at a university roundtable luncheon.
The tenth Workshop on Atmospheric, Earth, and Space Science in midsummer was held for five teachers and fourteen students.
Through the Summer Undergraduate Research Experience, a student built, tested and calibrated the GIFTS/GLOBE Sun Photometer for Water Vapor Special Measurements.
Trained 12 people in Australia to use VISITview, gave a 3.5 day workshop and training session to 35+ people in Australia.
Weather Guys Steve Ackerman and Jonathan Martin (AOS) made 12 monthly appearances on Wisconsin Public Radio’s Ideas Network.
Service and Honors
Data Center produced special satellite images for retiring Dean Virginia Hinshaw, Bob Herblseb, Bob Oehlkers.
Donald Johnson, SSEC scientist and AOS emeritus professor, was named special project scientist at National Centers for Environmental Prediction; isentropic modeling techniques to be shared.
Elaine Prins, NOAA Employee of the Month for May, was nominated by coworkers for team leadership and fire detection work.
GOES sounder products were used to correct astronomical measurements taken at the Pine Bluff Observatory-their detector response increased with precipitable water vapor measurements.
In first ten months of his tenure as field editor, Dave Martin and his staff processed ten manuscripts for the Journal of Applied Meteorology.
In the 9-11 aftermath, we provided satellite images on the Web and later explanations of the limits to satellite tracking capabilities.
NOAA’s Atmospheric Research and applications Division named Scott Bachmeier and Tom Whittaker Trainers of the Year for VISITView.
Paul Menzel was awarded NOAA Bronze Medal for national and international scientific leadership in space-based remote sensing.
Through OSSE WINNERSS project, Rose Pertzborn serves at NASA HQ.
Tom Whittaker joined the Thematic Realtime Earth Data Distributed Servers (THREDDS) team at Unidata/UCAR.
Wilt Sanders served as Academic Staff Executive Committee chair.
Acronyms List
A3RI—Antarctic Astronomy and Astrophysics Research Institute
ABBA—Automated Biomass Burning Algorithm
ADDE—Abstract Data Distribution Environment
AERI—Atmospheric Emitted Radiance Interferometer
AFWEX—ARM FIRE Water Vapor Experiment
AIRS—Atmospheric InfraRed Sounder
AMANDA—Antarctic Muon and Neutrino Detector Array
AMRC—Antarctic Meteorological Research Center
AMS—American Meteorological Society
AMSU—Advanced Microwave Sounding Unit
ARM—Atmospheric Radiation Measurement
AOS—(Department of Atmospheric and Oceanic Sciences
ASPT—Advanced Satellite Products Team (NOAA, stationed at SSEC)
ATOVS—Advanced TIROS-N Operational Vertical Sounder
AVHRR -Advanced Very High Resolution Radiometer
CIMSS—Cooperative Institute for Meteorological Satellite Studies
CIRRUS—Cloud InfraRed Radiometer for University-class Earth System Science
CLAMS—Chesapeake Lighthouse and Aircraft Measurements for Satellites
DOD—Department Of Defense
DOE—Department of Energy
ECMWF—European Centre for Medium-range Weather Forecasts
FIRE—First ISCCP Regional Field Experiment
GIFTS—Geostationary Imaging Fourier Transform Spectrometer
GLOBE -Global Learning and Observations to Benefit the Environment
GOES—Geostationary Operational Environmental Satellite
GPS—Global Positioning System
HIS—High-resolution Interferometer Sounder
HSP—High Speed Photometer
HST—Hubble Space Telescope
IAPP—International ATOVS Processing Package
ICDS—Ice Coring and Drilling Services
ICI—Inversion Coupled with Imager (Meteo France)
IDL—Interactive Data Language
IMAPP—International MODIS/AIRS Processing Package
INPE—Instituto de Pesquisas Espaciais (Brazil)
IOMI—Indian Ocean METOC Imager
ISCCP—International Satellite Cloud Climatology Project
kt—knots
LED—Light Emitting Diode
Lidar—LIght Detection And Ranging
McIDAS—Man computer Interactive Data Access System
MIT—Massachusetts Institute of Technology
MODIS—MODerate-resolution Imaging Spectroradiometer
MOPITT—Measurements of Pollution In The Troposphere
MUG—McIDAS Users’ Group
NASA—National Aeronautics and Space Administration
NAST-I—NPOES Atmospheric Sounder Testbed-Interferometer
NCAR—National Center for Atmospheric Research
NCEP—National Centers for Environmental Prediction
NESDIS—National Environmental Satellite Data and Information Service
NEXRAD—NEXt generation RADar
NHC—National Hurricane Center
NOAA—National Oceanic and Atmospheric Administration
NPOES—National Polar Orbiter Environmental Satellite
OSSE—Office of Space Science Education
PALMS—Precision Agricultural Landscape Modeling System
PEOPLE—Pre-college Enrichment Opportunity Program for Learning Excellence
SGI—Silicon Graphics Incorporated
SSEC—Space Science and Engineering Center
TC—Technical Computing
TIROS—Television InfraRed Observation Satellite
UnESS—University class Earth System Science
VIIRS—Visible Infrared Imager/Radiometer Suite
Vis5D—VISualization of Five-Dimensional data
VisAD—VISualization-Algorithm Development
VISIT—Virtual Institute for Satellite Integration and Training
WV IOP—Water Vapor Intensive Observing Period
WF-ABBA—WildFire ABBA
WINNERSS—Wisconsin Idea National Network-Education and Research in Space Sciences
WIYN—Wisconsin-Indiana-Yale-NOAO consortium
WMO—World Meteorological Organization
XRS—X-Ray Spectrometer