Flash drought: a new early warning system
By Zhengzheng Zhang
The year 2012 marked the largest drought occurrence in the 14-year history of the U.S. Drought Monitor (USDM) and was one of the most severe droughts to impact the U.S. since the Dust Bowl. At its peak, nearly 80 % of the lower 48 states were abnormally dry, with more than half of the country experiencing severe to extreme drought conditions. Designated a “flash drought” by USDM climatologists, it was characterized by its unusually rapid onset. The 2012 drought led to widespread crop failure and large reductions in livestock populations across the south-central U.S., with the Midwestern Corn Belt experiencing lower grain yields. The U.S. Department of Agriculture’s (USDA) Risk Assessment Agency estimated indemnity payments for the 2012 drought reached nearly $14 billion.
First coined in 2000 to describe the rapid-onset of extreme drought conditions in Oklahoma and Texas, flash droughts can rapidly attain peak magnitude in a matter of weeks; conventional droughts take several months or years to reach their maximum intensity and geographic extent. Flash droughts are particularly damaging to agricultural crops because they occur during prime growing seasons, allowing less time for those affected to respond to rapidly changing conditions. An improved early warning system would be especially useful in these situations.

Jason Otkin
Photo Credit: SSEC
Jason Otkin, an atmospheric scientist at the Cooperative Institute for Meteorological Satellite Studies (CIMSS) at the University of Wisconsin-Madison, is working with colleagues to produce a flash drought early warning system. Their system, based on a drought stress index that describes the severity of water loss in plants, will provide better detection and prediction of flash drought. Improved detection and prediction will aid in drought mitigation and climate adaptation efforts. Otkin’s research is pioneering, as flash droughts are not well understood and do not have a well-established forecast system.“Our end goal is to produce a more robust or more accurate drought early warning system,” said Otkin. “It will not only be capable of accurately depicting what the drought condition is now, but of providing advanced warning of drought development over short time periods for various stakeholders, such as farmers who are vulnerable to flash drought development. We are trying to provide weekly to monthly drought forecasts.”
The early warning system is based on a drought indicator called the Evaporative Stress Index (ESI) that uses satellite observations to estimate evapotranspiration (ET). Martha Anderson’s research group at the USDA has led the development of the ESI for many years. According to Otkin, ET shows water loss due to evaporation and plant transpiration to the atmosphere, and is an indicator of what the plants are experiencing.
For example, in summer, if ET is higher than normal due to high temperatures, soil moisture can be depleted very quickly, resulting in drought conditions. In addition to temperature, ET is also influenced by other atmospheric factors like precipitation, humidity, solar radiation (sunlight) and wind. Any of these factors alone can produce higher-than-normal ET. The moisture loss resulting from enhanced ET can result in a rapid deterioration of vegetation health. Flash droughts can develop if several extreme atmospheric factors occur at the same time and remain constant over the same area for several weeks. The results can be disastrous.
Although ET is a good drought indicator, it is difficult to make direct measurements of it over large geographic areas. To solve this problem, Otkin uses satellite-based remotely sensed maps of land surface temperature (LST) and a land surface energy balance model to estimate actual ET, based on the relationship between land surface temperature and the amount of water in the soil. Dry soil usually releases more heat than wet soil and has a higher temperature. The process, known as “sensible heat flux,” can be inferred from infrared satellite observations and used to calculate actual ET using an energy balance approach.
According to Otkin, the actual ET is often compared to how much ET would be possible if soil moisture were not limited. This is called potential ET. The Evaporative Stress Index describes the severity of drought conditions based on anomalies in the ratio of actual to potential ET. If there is sufficient soil moisture, actual and potential ET will have a similar magnitude and the ESI will be higher than normal. But if plants lack sufficient water, the actual ET will be lower than the potential ET, causing a decrease in the ESI. Decreases in the ESI are an indication of emerging drought and increasing moisture stress in plants.
Although there are many well-established drought indices, Otkin’s group is especially interested in the ESI product because “it seems particularly suited for identifying cases of rapid drought onset, and it seems to get signals of developing drought earlier than other [drought] products.”
Not all drought indicators work for flash droughts. For example, flash droughts are difficult to identify using traditional precipitation-based drought indices such as the standardized precipitation index (SPI), because precipitation deficits are the only input factor in that index. Unlike the ESI, it does not account for temperature, wind and radiation anomalies associated with flash drought development. Some flash droughts, such as the 2011 and 2012 events across the central U.S., can occur even when the SPI indicates only a moderate precipitation deficit.
Otkin and his team wanted to evaluate the potential value of including the fast-response drought indicator ESI within the USDM process to improve early detection of flash drought. To do this, they examined the evolution of several recent flash drought events that affected different areas of the United States. They compared surface meteorological data, USDM drought analyses and ET anomalies inferred by the ESI.
Otkin also computed the ESI composite over different time periods to identify different kinds of droughts and evaluate anomalous ET conditions across different seasons and regions. To look at how quickly each of those multi-week ESI composites change over different time intervals, Otkin’s group calculated ESI change rates or “standardized change anomalies.” The ESI change rate helps scientists more easily identify areas experiencing rapid changes in ET. They convey useful information about the speed at which vegetation health and available water for plants are deteriorating while providing early warning of early impacts on crop conditions.
“Large negative change anomalies indicative of rapidly drying conditions were either coincident with the introduction of drought in the USDM or led the USDM drought depiction by several weeks,” Otkin reported in a paper recently published in the Journal of Hydrometeorology.
Based on these standardized change anomalies, Otkin designed a new drought metric called the “Rapid Change Index (RCI),” which can more effectively provide early warning of an increased risk for flash drought intensification. Otkin is currently examining new methods to convert the RCI to drought intensification probabilities that may be more understandable and useful for stakeholders.
“The rapid change index by itself probably takes some time for people to get used to and how to interpret it,” Otkin said. “If I tell you the rapid change index has a value of -2, or has a value of -4, it probably does not mean a lot. But if I can tell you that -2 actually means a 40% chance that a flash drought is going to develop, and the -4 means a 70% chance of a flash drought, then people can use that information. I have done preliminary work to convert the RCI to drought probabilities and the results are all encouraging. It should hopefully provide some very useful probabilistic forecasts of drought development,” Otkin noted.
Otkin also emphasized that the flash drought prediction system they are developing is a “probabilistic forecast,” which means they can only tell the probability of future drought development; not its certainty. Based on the ESI alone, “there is no way to know exactly what is going to happen in the following days.” To make the probability prediction more accurate, Otkin plans to take advantage of climate model or numerical weather prediction model data to modify these probabilities.
“If I have an RCI-based probability of 50%, and the climate model shows it [the future weather] will be hot and dry, then I would increase it [the probability]. If it shows cool and wet, then I would decrease it. My ultimate goal would be to have the ability to merge what we are seeing in the current state with the ESI with what the actual forecast models are indicating in the future as a way to get the most accurate drought forecasts,” Otkin said.
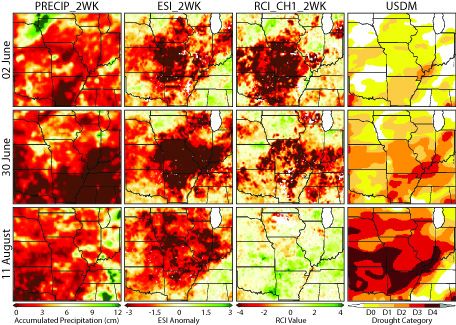
Time evolution of 2-week rainfall, 2-week ESI composites, Rapid Change Index, and USDM drought depiction from 02 June until 11 August 2012. Photo Credit: Jason Otkin
In addition to evaluating and refining the ESI and RCI products for an effective early drought warning system, Otkin said future work will also include exploring alternative RCI formulations that adapt to the needs of drought-vulnerable stakeholder groups, such as ranchers and farmers across the central and eastern U.S.
Moving from scientific research to real-life application, in the spring of 2014, Otkin’s group will present their early warning drought products to agricultural groups in Nebraska and Oklahoma. They hope to assess the usefulness of these products and learn how farmers might use the information.
“But to get from what we know to what they want, it takes a lot of interaction, that is what we are going to do in this project,” Otkin noted.
(Feature Image Credit: U.S. Drought Monitor, August 21, 2012, released on Thursday, August 23, 2012)