More Than a Pretty Picture: McIDAS Celebrates 40 Years
by Leanne Avila
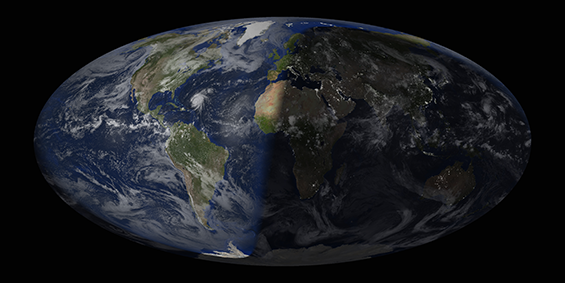
Composite Image of the World: Processed using McIDAS, the image from August 20th, 2009, is a mosaic of data from geostationary and polar orbiting satellites. Data were collected from meteorological agencies around the world including the United States, Europe, China, and Japan. Image credit: Rick Kohrs, SSEC.
“[It] was a fascinating way to extract information out of satellite images. It was almost intoxicating.”
Take it from Dave Martin, an SSEC scientist who was among the first to use the Man computer Interactive Data Access System (McIDAS) in a research project shortly after its development in 1973. A revolutionary visualization and data analysis system developed at SSEC, McIDAS celebrated 40 years of innovation in October 2013.
Over those four decades McIDAS has changed significantly, from a hardware and software system for which developers had to build their own hardware to today’s fifth generation system of free, open-source software, known as McIDAS-V (for more technical details about the first four generations, please see the Bulletin of the American Meteorological Society article celebrating the 25th anniversary of McIDAS published in 1999). The one constant has been its pioneering capabilities that Martin and countless others have found not only alluring, but vital to their work.
Imagine using paper printouts of satellite images and data to analyze cloud movement and weather patterns. While not impossible, it was very labor intensive. Eager for a more efficient and automated approach, SSEC Founder Verner Suomi devised a competition within SSEC to see who could construct a working model using cutting-edge technology. This strategy was very much in line with Suomi’s management strategy, which embraced experimentation and conflict, according to SSEC Emeritus Senior Scientist Bill Hibbard. Martin noted that the competition took on life outside the building as Suomi was at the same time competing with University of Chicago researcher Ted Fujita, who developed the Fujita Scale which classifies tornado intensity based on the damage caused by the tornado. Each was trying to be the first to determine “the best way to analyze sequences of geostationary satellite images. And of course, we all know who won that competition,” remarked Martin.
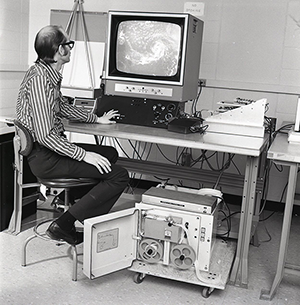
The Windco display and control console successfully demonstrated a means to access image matrix information so that meteorological parameters such as cloud motion, sunglint, and cloud dynamics could be extracted and analyzed. Photo credit: SSEC, UW-Madison.
Suomi’s internal competition pitted two alternate approaches, an analog method versus software. In the end the software approach, known as WINDCO, was more successful.
SSEC scientist Matthew Lazzara noted that Suomi was also enthralled with the idea of instant replay in football and how that new technology, or something similar, might be applied to what they were seeing on paper. According to Lazzara, Suomi wondered, “Why can’t we animate them [the satellite pictures]? Let’s do something with them.” Determined to make that vision a reality, Suomi and his team did just that, animate the satellite images, using the same technology, the analog disk.
With success came additional funding which led to the unveiling of the first generation of McIDAS in 1973. McIDAS offered a new way of displaying, analyzing, interpreting, acquiring and managing geophysical data. Initially there was but one McIDAS system located inside SSEC. The first McIDAS installation outside of SSEC went to the Air Force Geophysics Laboratory (AFGL) in Massachusetts in 1975. According to Lazzara, AFGL “bought it off the floor and we had to build another one.”
Interest in McIDAS grew tremendously in the late 1970s, particularly after the Wichita Falls, TX tornado of 10 April 1979. Forty-two people lost their lives. Following a Congressional investigation, which included a visit to SSEC, to determine how to minimize loss of life due to severe weather, the National Oceanic and Atmospheric Administration (NOAA) requested its own McIDAS system.
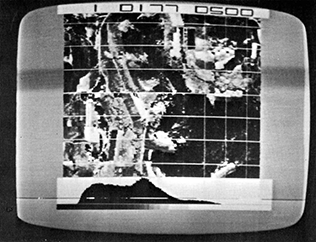
Though granular by today’s standards, processing earth resources data was easier with the image comparison and measurement capabilities of McIDAS. Photo credit: SSEC, UW-Madison.
SSEC researcher Tom Whittaker was quick to identify what was critical to the broad success of McIDAS and what drove users to it: its unique ability to create composites. Users could layer multiple types of data, satellite, model observations, etc., in one display. At the 57th Annual Meeting of the American Meteorological Society held in Tucson, Arizona in January 1977, Whittaker demonstrated this capability to the public for the first time. According to Whittaker, McIDAS was in its very essence likely the first GIS (Geographic Information System) system in the world.
As groups acquired their own McIDAS systems from SSEC, they would frequently rename them. NOAA’s version became IFFA for Interactive Flash Flood Analyzer. A version bought for space shuttle operation was named MIDDS (Meteorological Interactive Data Display System) – “still McIDAS” noted Lazzara. When CIRA (Cooperative Institute for Research in the Atmosphere) took McIDAS and added a user interface, they called it RAMSDIS (Regional and Mesoscale Meteorology Team Advanced Meteorological Satellite Demonstration and Interpretation System), which made its way not only to third world countries but into National Weather Service (NWS) Offices. “That was a big deal – getting McIDAS into NWS offices, getting satellite data in there,” which happened before AWIPS (Advanced Weather Interactive Processing System), commented Dave Santek, the current McIDAS principal investigator. AWIPS is the processing system used by NWS to create forecasts.
Following up on Santek’s statement, Lazzara emphasized the reach of McIDAS in the research and operational environments. A relatively unknown fact… anyone receiving satellite data from the NOAAport distribution in the form of GINI (GOES Ingest and NOAAPORT Interface) images has benefitted from McIDAS as those images are built using McIDAS “under the hood.”
Lest you think that the impact of McIDAS is restricted to the realms of research and operations, consider Hibbard’s words on its legacy. “If you were going to have one sentence to summarize what McIDAS means… every person in the world who has access to a television set uses Verner Suomi’s invention.” By invention Hibbard not only meant McIDAS, but also weather satellites in space, given Suomi’s pioneering work in satellite technology as well.
Viewing the system from a computer science perspective, Hibbard attributed the longevity of McIDAS to its design and, by extension, one of its main designers, John Benson. While from a researcher’s perspective, Martin commended Benson’s design for its ability to work with quantitative measurements. “It wasn’t just a pretty picture on the screen,” Santek concurred.
Hibbard remarked that this philosophy of highlighting the importance of the data remained critical to visualization development at SSEC, from VisAD through McIDAS-V. Other groups took note of that success and sought to emulate those capabilities. However, as Santek pointed out, some users were not satisfied with what the competition was able to provide. Due to their unique set of requirements (from timeliness to the ability to manage a significant number of data sources), Cape Canaveral has had a McIDAS system for 25+ years because “nothing could compete with McIDAS in terms of performance and usability.”
From the moment McIDAS systems went out into the world, the delicate task of balancing research and development with the need to support operational users began. Over time McIDAS has expanded into educational and commercial realms as well.
Today McIDAS continues to extend its reach around the globe. In recent years, environmental companies have shown interest in McIDAS as it not only allows access to current, but also archived, data. Members of the McIDAS User’s Group (those using the fourth generation McIDAS-X) number over 40 while hundreds have downloaded the fifth generation McIDAS-V. Weather services around the world, including Spain, Australia, and Greece, depend on McIDAS.
While SSEC will continue to support McIDAS-X through at least 2020 and the present generation of GOES weather satellites, McIDAS-V will be the focus for innovations. In recent years SSEC programmers have worked diligently to add new capabilities as new sensors, such as those on Suomi NPP, come online.
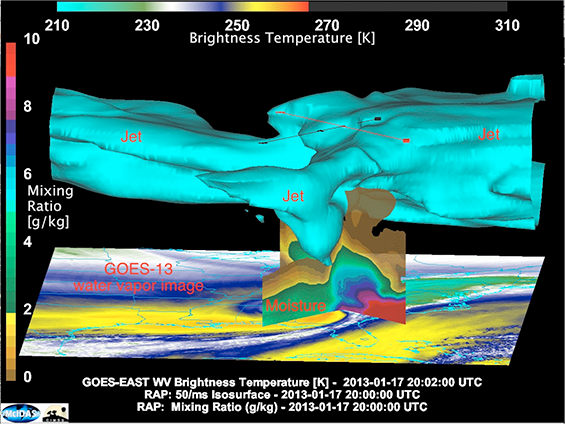
This image, produced in McIDAS-V, combines a GOES-13 observation of a classic baroclinic leaf signature from 17 January 2013 with concurrent NOAA Rapid Refresh (RAP) model wind and moisture fields. The system produced significant snowfall in Tennessee, North Carolina and Virginia. The drier signature in the water vapor imagery corresponds to the upper level dry intrusion visible in the jet stream (cyan) while the ascending moisture associated with the warm conveyor belt is clearly visible in the moisture cross section. Figure credit: Scott Bachmeier and Joleen Feltz, CIMSS.
Among its many achievements, McIDAS also can list a number of firsts. With the help of McIDAS, cloud tracking on Jupiter and Saturn using Voyager data was possible, as was imaging of biochemistry gels to analyze protein spots. It served as a catalyst for countless research endeavors.
“McIDAS has been a facilitator for the development of other big things. CIMSS [Cooperative Institute for Meteorological Satellite Studies] wouldn’t exist without the McIDAS project. Unidata wouldn’t exist without the McIDAS project.” Lazzara went on to note that Bill Smith came to the UW-Madison as a result of work Suomi was doing with McIDAS and satellite soundings; Smith would later become a director of CIMSS. With funding from NSF, Unidata would go on to bring software and data to colleges and universities without their own McIDAS-type system.
Over the 40 years McIDAS has undergone architectural changes and adaptations to suit the needs of its users. In that wake it leaves behind a legacy unlike any other visualization tool.
* This article is the result of an interview conducted with SSEC’s Dave Martin, Matthew Lazzara, Bill Hibbard, and Dave Santek on 19 November 2013, plus additional discussions with SSEC’s Tom Whittaker.
Featured image on the SSEC home page: McIDAS-V processed image of rapidly evolving convection over Wisconsin. Image credit: Joleen Feltz and Mike Hiley, CIMSS.