The world according to GATE (and GARP): Legacies of a 1974 field campaign
By nearly any measure, it was the largest and most complex international field experiment ever conducted in meteorology up to the mid-1970s.
Known as the GARP Atlantic Tropical Experiment (GATE) it was the first observing phase of the Global Atmospheric Research Programme (GARP) lasting 100 days during the summer of 1974. The experiment region spanned the tropical Atlantic Ocean from South America to Africa, between 20° N latitude and 10° S latitude.
Photograph, array of GATE vessels, circa 1974, Joachim P. Kuettner Papers, 1938-2010, GATE: Photographs, undated, Archives, National Center for Atmospheric Research.
Graduate students and scientists who went on to spend their careers at the Space Science and Engineering Center (SSEC) or the Department of Atmospheric and Oceanic Sciences (AOS) at the University of Wisconsin-Madison played crucial roles in planning, data collection, testing, and post-analysis during GATE. Most of them were early career scientists, exhilarated by the intellectual and physical challenges posed by the experiment.
Before, during, and after GATE they made important and lasting contributions to their fields.
GATE uniquely marshaled the resources of more than 70 nations — nations such as the Soviet Union and the United States set aside their Cold War political differences for the benefit of scientific cooperation. Participating countries not only committed thousands of personnel to the program, but contributed ships, research aircraft, instruments, and meteorological satellites to collect observations of the tropical atmosphere on an unprecedented scale.
The planners were well aware of the difficulties and risks of such a large collaboration — there were great successes along with disappointments in data collection methods and data quality. SSEC and GATE emeritus scientist Dave Martin commented, “the more people involved, the greater the risk of diffusing the goals of the experiment.”
According to AOS Emeritus Professor and GATE scientist John Young, “There were more minds, more instruments, more resources, more technology made available by every nation in order to measure the atmosphere in the GATE region.”
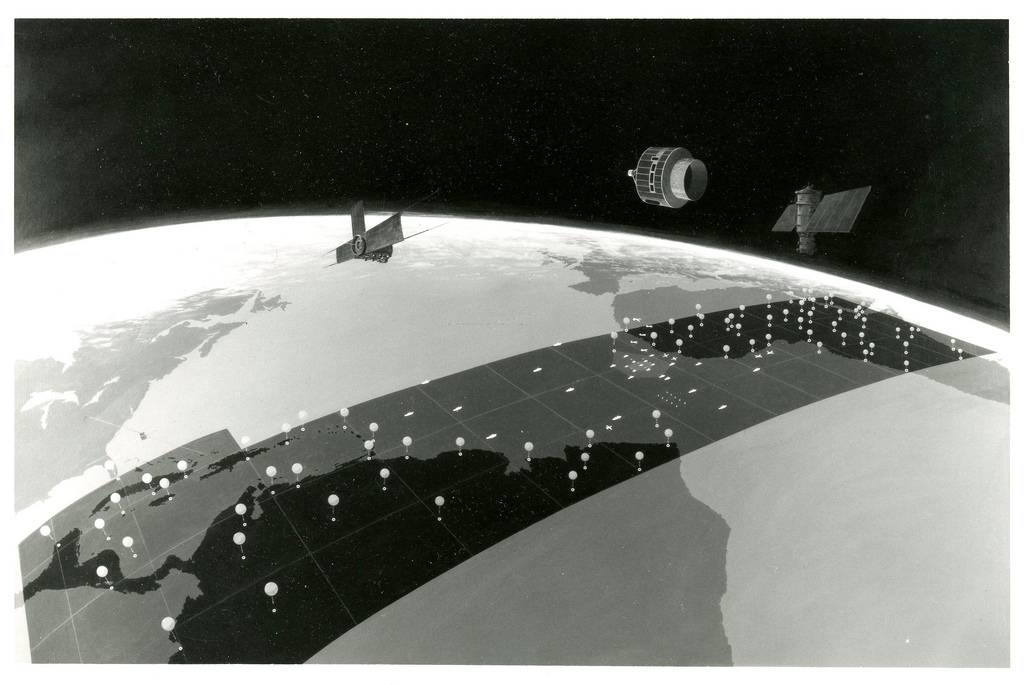
Organizers of GARP, which fell under the auspices of the World Meteorological Organization, included the late Verner Suomi, SSEC co-founder. Suomi was an influential member of the larger GARP planning committee, helping to formulate strategic objectives for the experiment. As a prominent voice from the United States, he and other leaders of the program envisioned an intensive observing period to study the tropical Atlantic atmosphere and its role in driving the general circulation. There also was a growing demand for better numerical modeling and prediction capabilities and better representation of clouds in simulations.
Scientists wanted to study more closely convective rain systems in the tropics where disturbances develop and produce vertical transport of energy in the form of heat and water vapor. This transport is a critical link between the sun’s energy absorbed by the ocean, evaporation into the air, and ultimately, the warming of the tropical atmosphere by condensation from rain systems.
Associated convective clouds (cumulus clouds) tend to form “cloud clusters” from which energy and water vapor are released. This energy is often transported well into the middle latitudes where it can influence weather patterns.
Don Wylie, emeritus SSEC scientist, participated in GATE as a graduate student. As Crew Chief on the Oceanographer, a NOAA ship, he helped run the Boundary Layer Instrumentation Systems (BLIS) on that vessel. The BLIS instrument was designed by Suomi and constructed at SSEC. It was accepted as the balloon-borne boundary layer instrument from the United States.
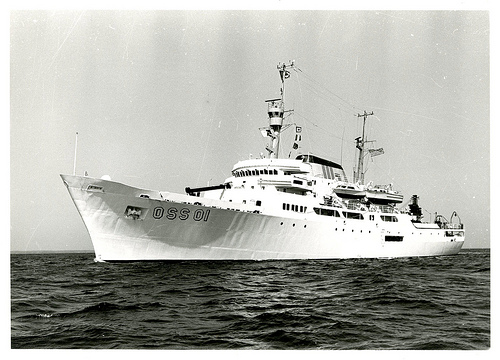
Photograph, Oceanographer, circa 1974, Joachim P. Kuettner Papers, 1938-2010, GATE: Photographs, undated, Archives, National Center for Atmospheric Research.
“BLIS was a system of four balloon-borne instruments flown at altitudes up to 1,000 meters for collecting data on temperature, humidity, and winds,” recalls Wylie. The BLIS instruments were lifted by a small helium-filled blimp tethered to the ship, attached to a tether line at four levels.
According to Wylie, the biggest obstacle to BLIS was the hot, humid, and salty tropical atmosphere. Together, the humidity and salt corroded the electronic circuit boards. Mold was also a problem, often growing inside the instrument packages after exposure of just a few hours.
Another problem for BLIS was vibration of the balloon’s nylon tether line. The vibration frequently damaged or broke sensitive parts of the instrument.
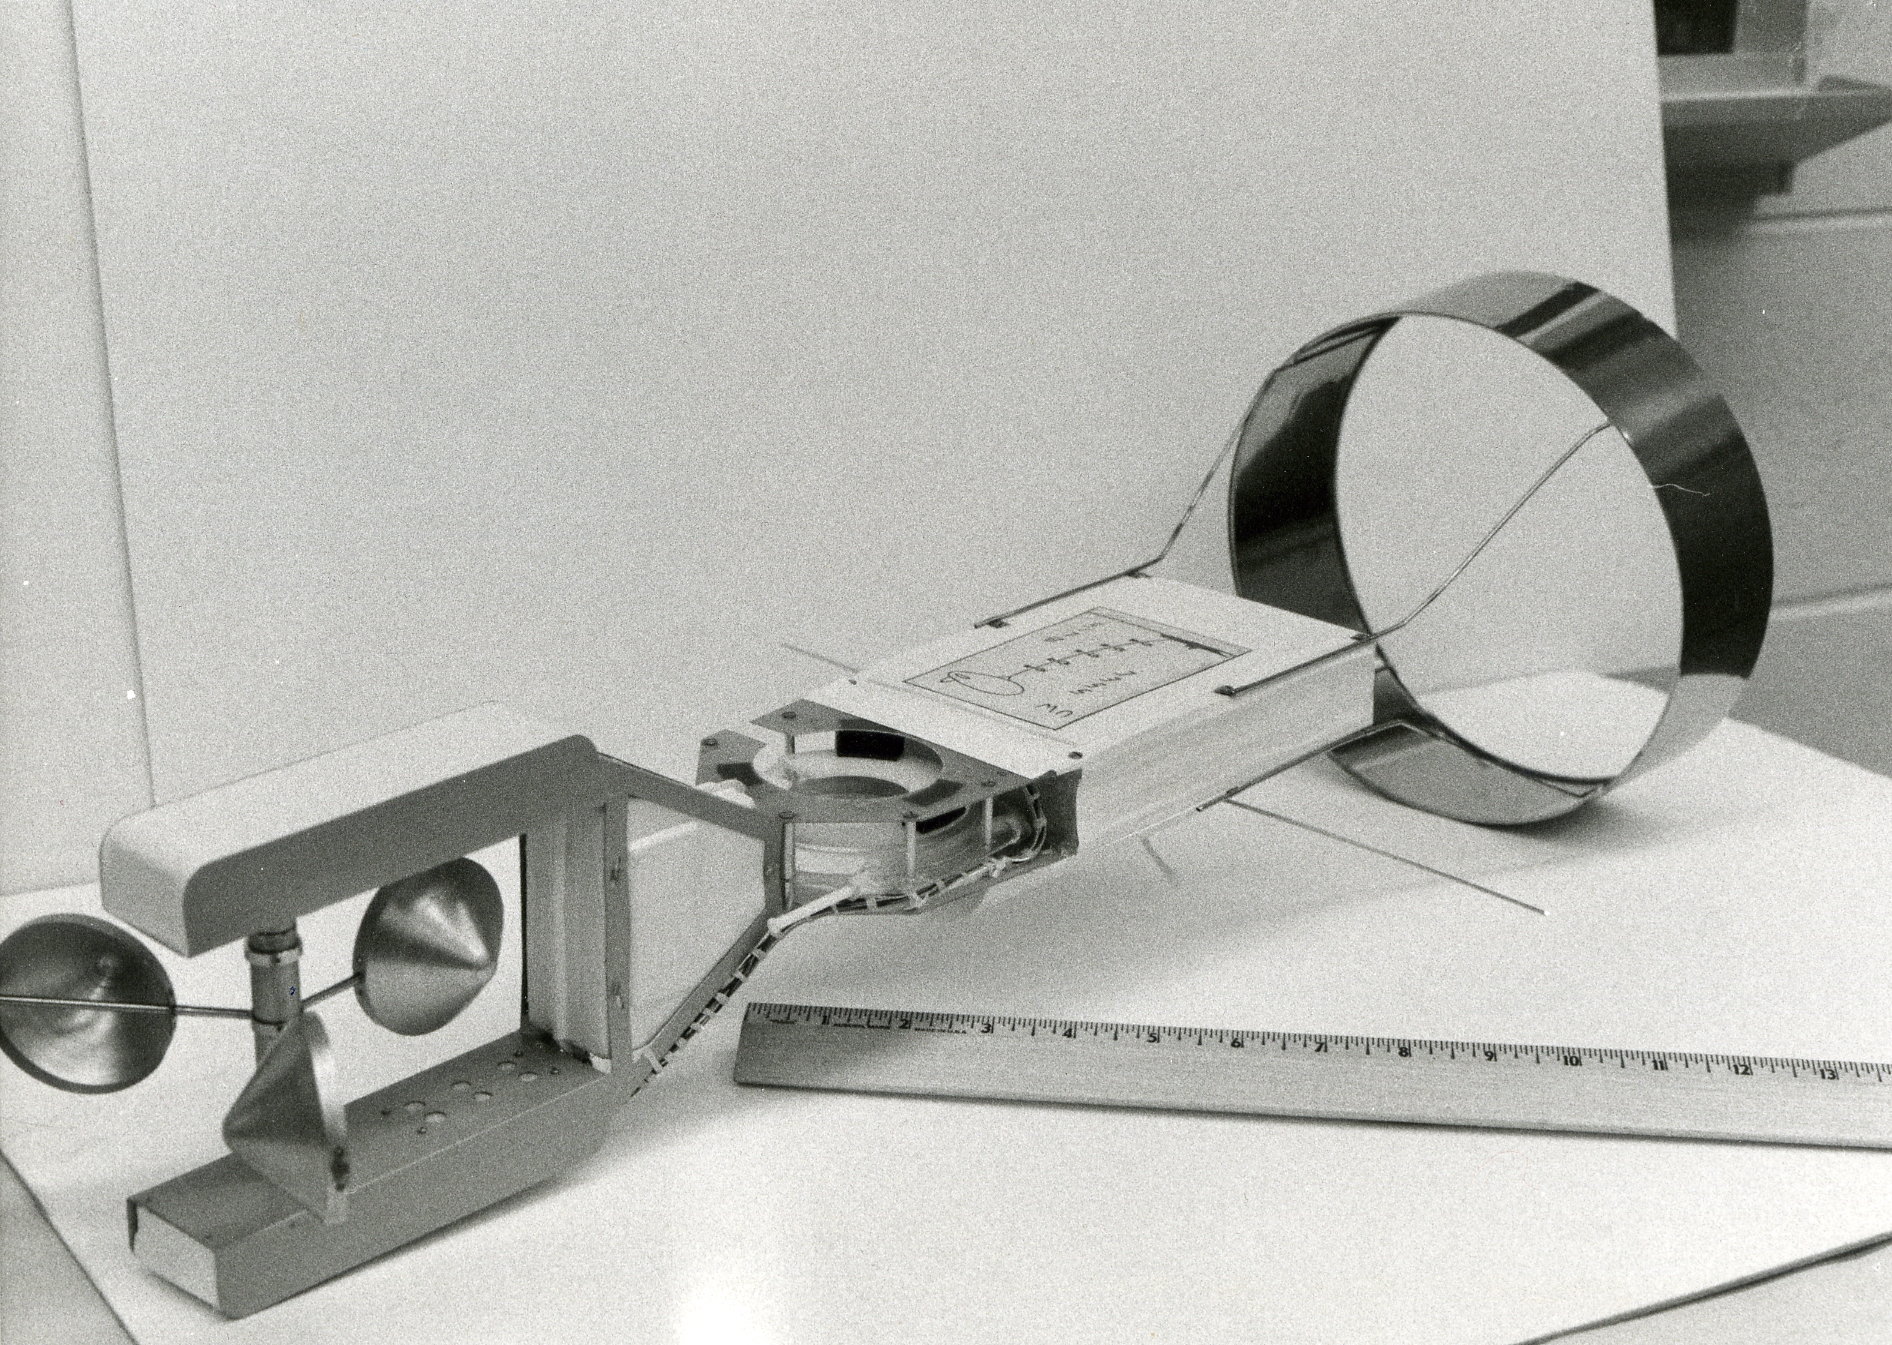
A tethered sonde, the Boundary Layer Instrumentation System, was designed to be used from ships during GATE. Credit: Space Science and Engineering Center (SSEC), University of Wisconsin-Madison.
Suomi had been optimistic about the performance of BLIS but Wylie explains that while it provided useful information about the tropical atmosphere, it was less than anticipated. Scientists required far more precise measurements and a larger sample than could be collected from one time period in order to accurately measure the upward movement of moist tropical air. Previously, the best measurements had come from stable, tower-mounted instruments or instruments on aircraft.
For Wylie, it was a tremendous education. He “learned about the development and deployment of new atmospheric observational equipment and about the politics of working in large groups,” he said.
Beyond the BLIS system, there were other challenges. The best instrument at that time for collecting wind, temperature, and humidity data was the radiosonde, which performs very well over land, employing a simple radio tracking antenna to detect winds and wind direction. It does not perform well on the ocean where ships drift. Today, scientists might use the Global Positioning System for tracking, but in 1974, GPS did not exist.
To manage this problem, organizers decided to equip all ocean vessels with another system, the Omegasonde, an alternative to the conventional radar-tracked radiosonde. It involved Omega signals broadcast from ground stations, using the time delay in receiving the signals from three distant locations to track the package, and thus monitor winds.
The original GATE experiment design called for most ships to be stationary. The NASA Vanguard, however, would travel north and south looking upward in the boundary layer, taking frequent measurements. All other ships would take wind field and other measurements from their assigned locations. The general idea was that a ring of ships providing data would show in-flow and out-flow of winds, producing a smaller-scale budget study.
According to John Young, chief scientist on the Vanguard, “It turned out the Omega signals on the other ships were varied and weak right where the experiment was to go on.” This was due to the distance of the ground stations.
As a remedy, the Vanguard, which was equipped with a radar satellite tracking system, was placed in the middle of the array to collect wind data. Responding to the severity of the problem, the Soviet Union also repositioned one of its ships in the array.
“The first time I saw what our winds looked like, I knew that it would work,” recalls Young. “It was golden!”
The NASA-developed tracking software along with ship radar would determine the location of a small, aluminum reflector in the package as it moved, converting this information to winds.
The Vanguard accumulated a reliable, believable, high quality set of upper-air wind data during the GATE experiment that would prove useful in comparison studies, notes Young. The data set suggested unique wind features in the atmospheric layers of the GATE region, adding to the growing body of knowledge about tropical atmosphere properties.
The Omega data quality raised concern among the organizers of GATE, prompting a large meeting of the committee members to discuss possible solutions. Suomi and senior leadership of GATE wanted to find a way to improve the omega signal sufficiently to get useful data from the soundings. According to Young, very careful — and costly — post-processing by computer programmers in Washington turned the raw signals into useful wind information, salvaging some of the data.
Rather than surface-based data collection, GATE scientist Dave Martin’s contributions focused on using geostationary satellite images to identify cloud clusters and the deep moist convection associated with them known to move heat from the oceans to the free atmosphere.
The Synchronous Meteorological Satellite 1 (SMS-1) was launched on 15 May 1974, only weeks before the start of GATE. It was a prototype for a new generation of operational geostationary satellites. It wasn’t entirely clear whether the satellite would perform well, but it successfully sent images to the NOAA receiving station at Dakar, Senegal, the command post for the experiment where Martin was stationed.
Forecasters for GATE reviewed SMS images from the afternoon of one day to help prepare aircraft forecasts for the following morning. Anyone — forecasters, scientists, synopticians — had access to the images.
Once forecasts were complete, Martin could examine the images, looking for cloud clusters, working in a lag of one day.
“I don’t think I’ve ever worked harder than I did during the three-month period of GATE,” remembers Martin. “It was a daily grind of keeping up with the flow of SMS images — not much time for sightseeing. It was exciting, stimulating, arduous, and at times, frustrating.”
Utilizing satellite convective code that had been developed at SSEC, Martin evaluated the convective intensity of a cloud cluster — its size, lifetime, movement, and duration over the area. As a consequence of GATE, Martin constructed an enormous catalog of cloud cluster information that demanded analysis, interpretation, and understanding.
In Dakar, Martin experienced challenges with navigation of the SMS images. Navigation, or properly aligning the satellite image to the corresponding land location, was improving but was still less than perfect.
Upon his return to the university, Martin and colleagues began analyzing the data, for nearly 10 years, until the main body had been reviewed. There were conferences, workshops, special sessions devoted to GATE findings. In addition to his work with cloud clusters, Martin used the visible and infrared SMS images to examine and define conditions for Saharan dust outbreaks. The images provided a mechanism for tracing the source of dust clouds over water seen in visible and infrared images back in time, to West Africa. Satellite imagery proved it could be a powerful tool for identifying dust cloud transport. Related research continues at SSEC today.
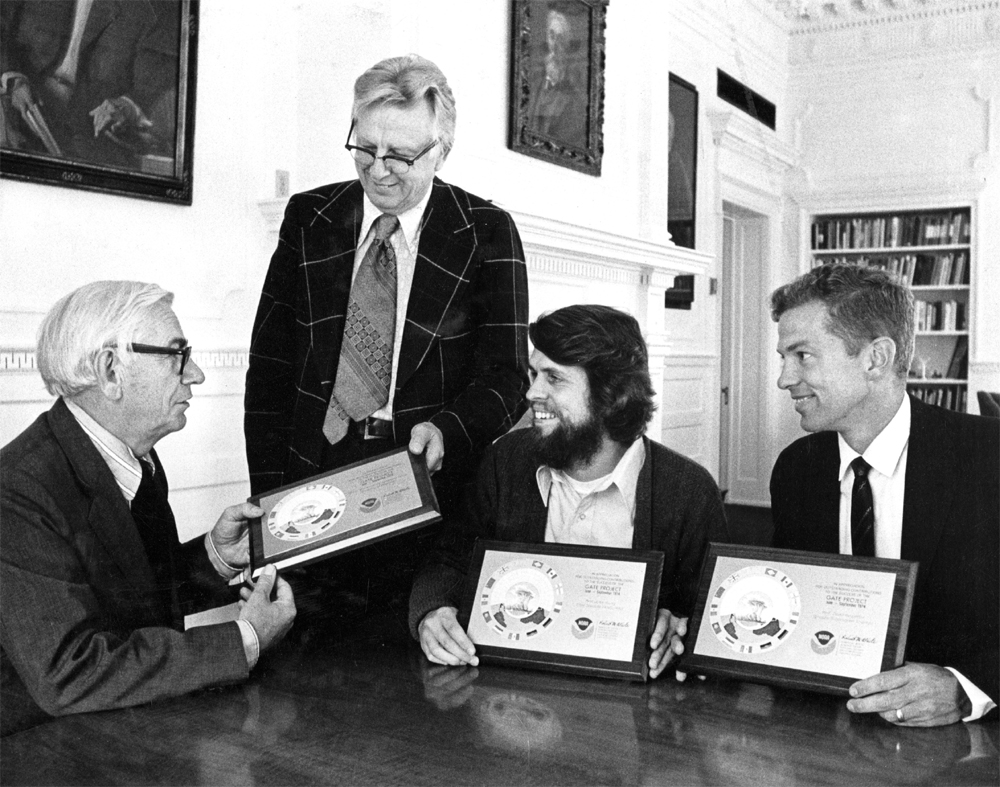
University of Wisconsin-Madison Chancellor Hugh Edward Young (left) presents V.E. Suomi (standing), J.A. Young, and D.D. Houghton with awards in recognition of their contribution to GATE. Circa 1974. Credit: University of Wisconsin Communications.
By the time GATE concluded, geostationary satellites were rapidly becoming the tool for recognizing tropical disturbances before they made landfall. Wylie notes this was very important to the hurricane warning system and SSEC’s Man-computer Interactive Data Access System (McIDAS), only recently demonstrated to a public audience in 1973, which was rapidly becoming one of the most important tools for visualizing geostationary satellite data.
The flood of satellite data collected and archived for GATE spurred the further development of McIDAS, providing another proof-of-concept for the system.
Even during GATE, scientists at SSEC were actively trying to resolve the satellite navigation problems experienced by Martin in Dakar. Ultimately, according to Martin, that problem was solved at SSEC, post-GATE, together with engineers and mathematicians from the National Oceanic and Atmospheric Administration. The SSEC-developed system transformed geosynchronous satellite coordinates to a reference point on earth and could handle sequences of images such as those generated from the SMS satellite. Martin notes that SSEC has evolved because of satellites and it’s been a magnificent success.
“Any young scientist given an opportunity like this should seize it. GATE was a unique, marvelous experience. Very rewarding,” adds Martin. “It impressed upon us the value of cooperation, of free and open exchange of data, of having good people in positions of responsibility, and the importance of grassroots participation by the scientific community.”
An important legacy of GATE, says Don Wylie, is that it “left behind energy in many countries to maintain better weather observation and forecasting systems.”
The follow-on to GATE was the First GARP Global Experiment in 1979 which was appropriately renamed the Global Weather Experiment. Planners incorporated the lessons learned from GATE into the next experiment.
Four decades hence, John Young provides an interesting perspective on our technological and scientific progress, saying, “We had all this high-tech equipment, but back in 1974 if I wanted to call home from our ship in the tropical Atlantic, I had to have the call patched through ham radio — and maybe it would work. Compared to today’s technology, it pales.”
Note: Many scientists and engineers from SSEC and AOS made contributions to GATE, either at the experiment site or through the provision of support from Madison. Among them were: Brian Auvine, Ken Bures, Stan Burns, Bob Herbsleb, David Houghton, David Martin, Jim Maynard, Fred Mosher, Dennis Phillips, Evan Richards Dhirendra Sikdar, Eric Smith, John Stout, David Suchman, Verner Suomi, Donald Wylie, John Young.
by Jean Phillips