Lake Mendota buoy supports collaborative research and citizen science
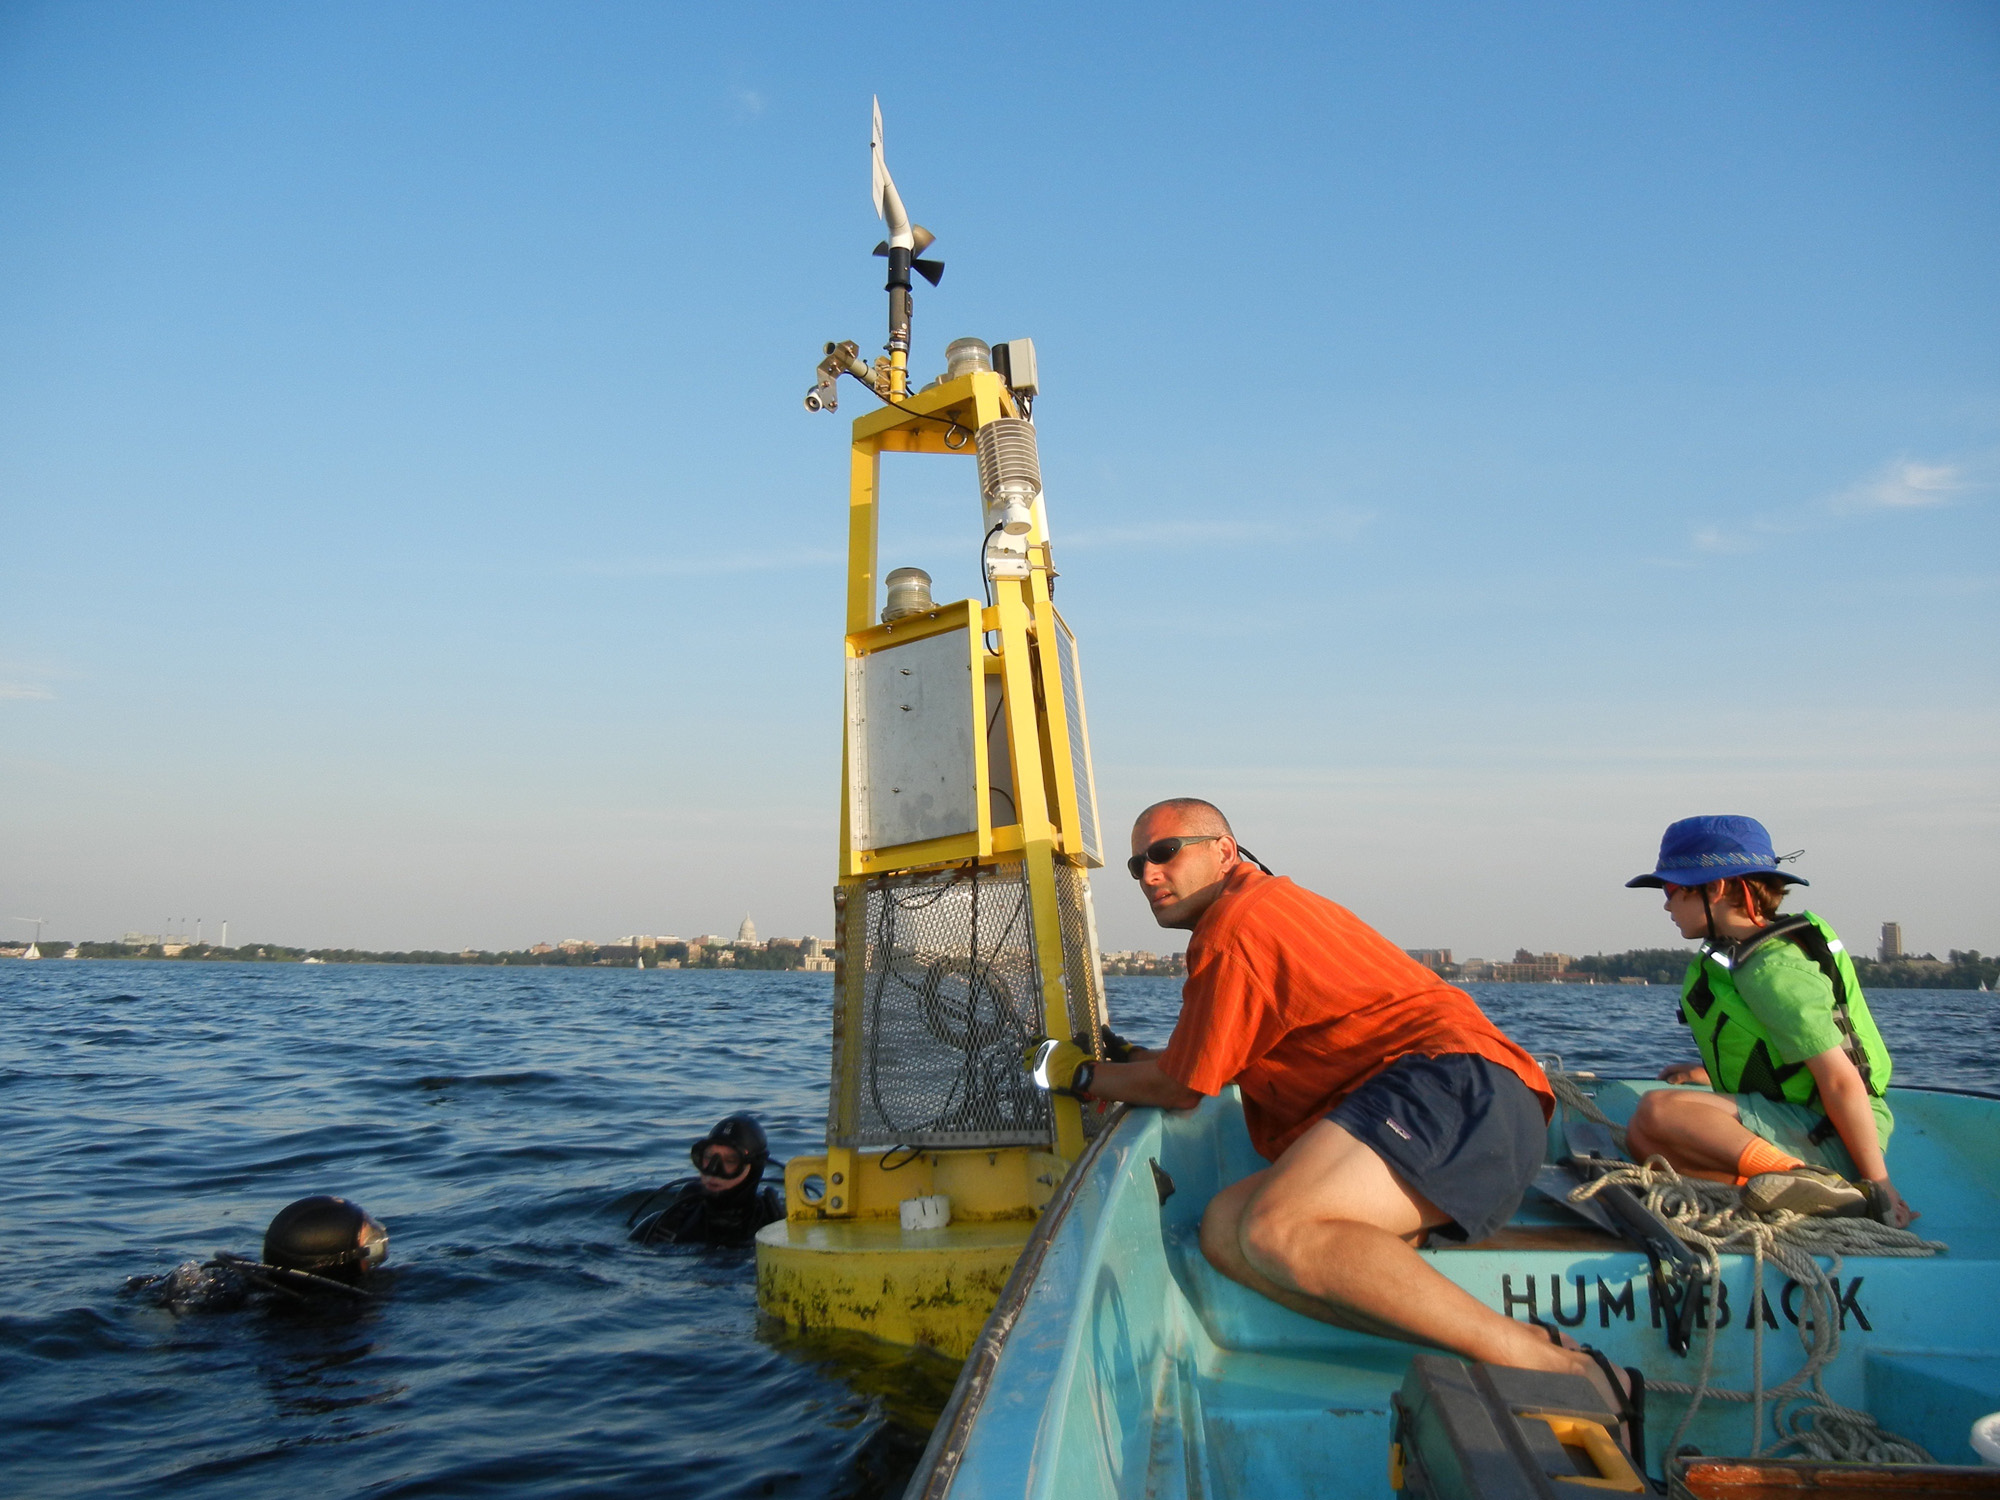
Jonathan Thom, with help from volunteer divers, deploys the Lake Mendota buoy on May 28, 2015. Credit: SSEC.
Looking to the northeast from the tip of Picnic Point, the yellow Lake Mendota buoy floats mid-way between it and Maple Bluff, at 43.1 degrees north and 89.4 degrees west. A quiet example of The Wisconsin Idea, the buoy is outfitted with a suite of sensors that routinely and reliably transmit atmospheric and aquatic conditions from the deepest part of the lake known as the deep hole.
The data are used by scientists and students at the University of Wisconsin-Madison and collaborators around the world. It’s also in high demand by local boating enthusiasts, fishermen, rescue and weather agencies, and citizen scientists – all of whom interact with the lake and have an avid interest in knowing its conditions and monitoring its health.
“It’s deployed every summer in the same location, in the deep hole of the lake, which is roughly 83 feet deep,” explains Jonathan Thom, a researcher at the UW-Madison Space Science and Engineering Center (SSEC). “We start getting calls and emails in the spring from lake enthusiasts wanting to know when the buoy will be deployed.”
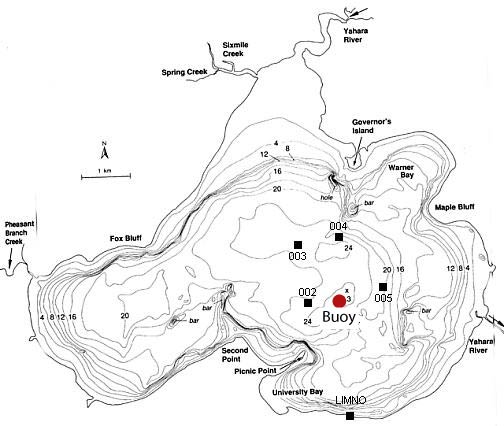
Location of Lake Mendota buoy.
Thom is relatively new to the buoy project, an ongoing collaboration among several departments, including the UW Center for Limnology, the Department of Civil and Environmental Engineering, and SSEC.
“Jonathan is so good – he refurbishes, rewires, takes care of it, and suddenly things are running seamlessly,” says Emily Stanley, professor of limnology and principal investigator for the North Temperate Lakes Long Term Ecological Research (LTER) program at UW-Madison and a primary user of the buoy data.
“We at Limnology are responsible for getting the buoy out so that we have an uninterrupted data stream for our research, explains Stanley. “The partnership with SSEC has evolved so that SSEC is taking a leading role with deployment and data receiving.”
Long before the buoy is deployed in late May, however, Thom tests all of the sensors, equipment, and wiring in his lab at SSEC to be sure that each instrument is operating as expected.
Those data must also be received and archived in order for it to be of use to others. Thom works closely with Bruce Flynn, an instrumentation technician at SSEC who lends his programming expertise to the project. According to Flynn, the data are transmitted via wireless link between the buoy and SSEC.
“The public website hosted by SSEC is updated every two minutes with new readings and the older data is archived,” says Flynn. “Limnology then pulls their aquatic data from our site to their lab.”
The data are freely available to anyone who wants to use it – that’s pretty much the philosophy of this project, notes Flynn, for the meteorological data and the aquatic data, and many other datasets at SSEC, “the data should be available.”
Now in his third season, Thom is getting the kinks out of the deployment process. A number of years ago SSEC upgraded the electronics on the buoy, as well as the buoy design, to better guarantee its reliability and its ability to weather the Mendota conditions, including curious birds and hooligan boaters.
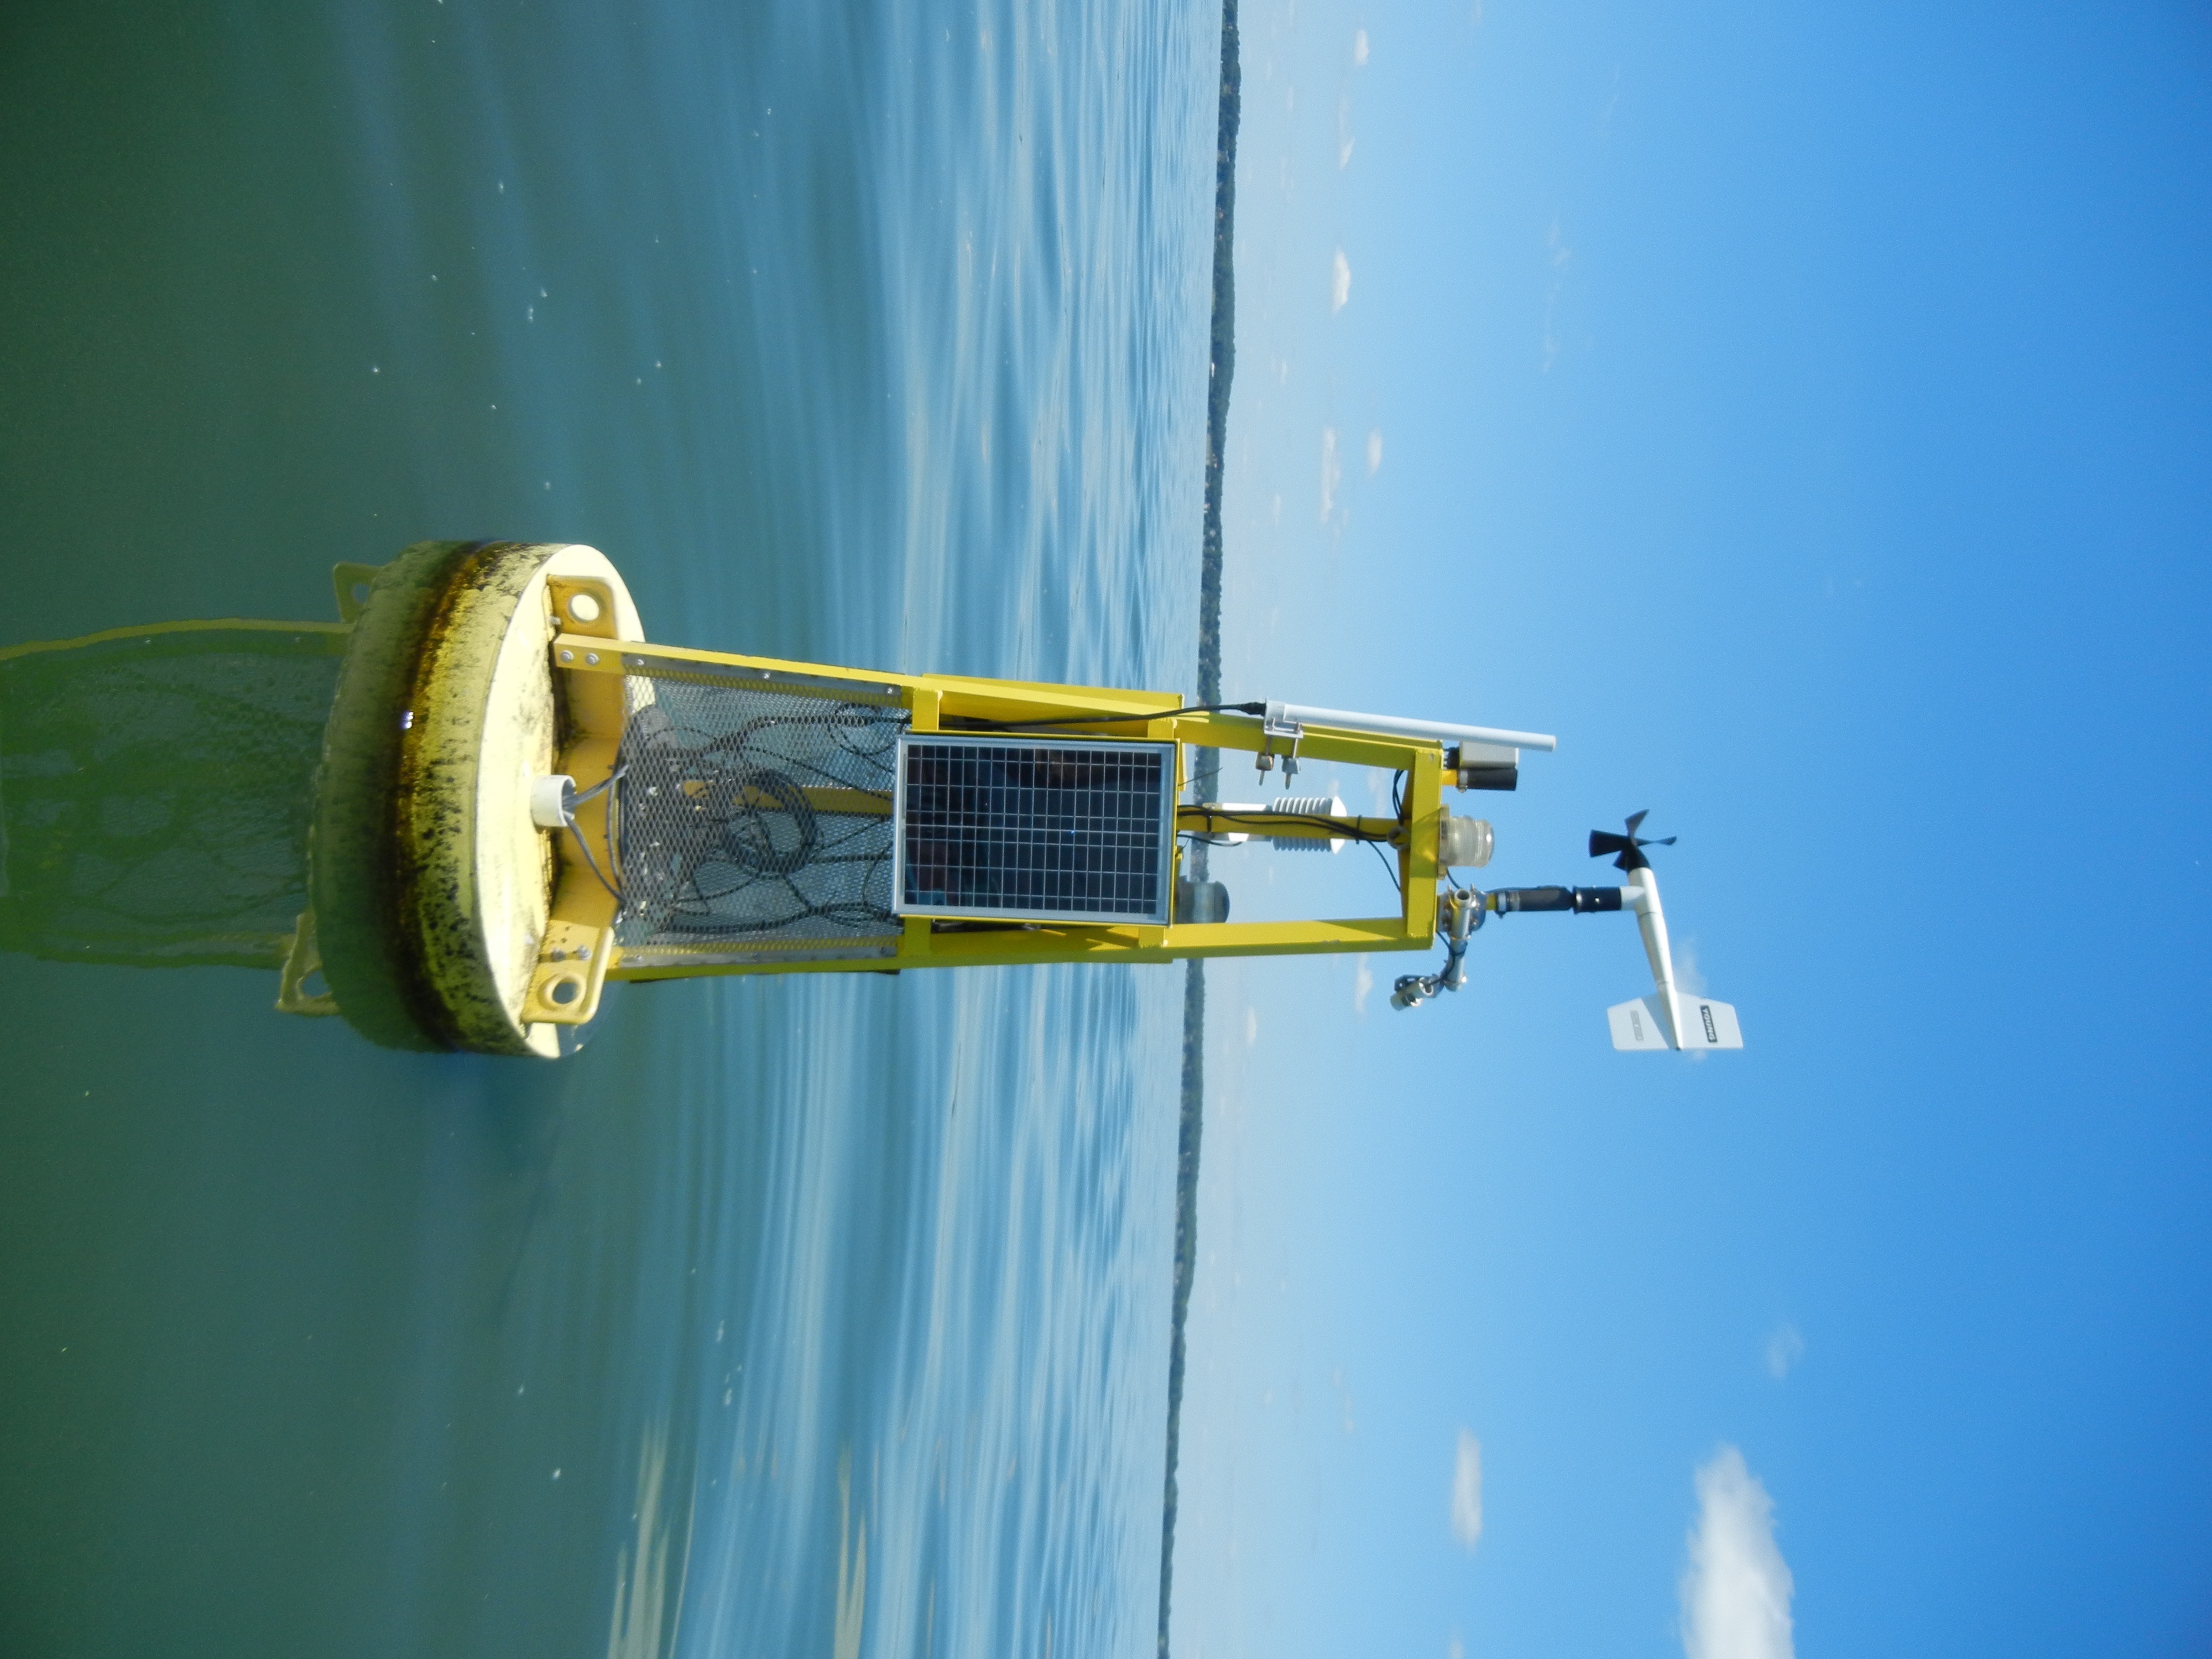
Lake Mendota buoy. Credit: Jonathan Thom.
The buoy is instrumented to take measurements above and below the water’s surface. Thom explains that above water measurements include wind speed, wind direction, air temperature, and relative humidity. There is also an infrared thermometer trained on the lake to measure the surface-skin temperature: that paper-thin, top layer of water.
There is an elaborate set of instruments below the surface of the water, too. One sensor measures dissolved oxygen, an important indicator of water quality, and a temperature string provides a vertical temperature profile from the surface down to 20 meters, and another sensor measures the amount of dissolved carbon dioxide in the water. Two fluorometers measure phycocyanin and chlorophyll in order to better understand the effects of harmful algal blooms on the ecology of the lake.
It is these below-surface measurements that interest Stanley because they serve as a point of reference – a thumbtack of sorts – for water sampling around the lake, showing how that single point is changing over time.
“We use the buoy data extensively for LTER as we learn about how the health of our lakes is interconnected to atmospheric, climate, and human processes,” she says. “It’s a core data stream for us.”
Ecosystems are never static, and the ecology of Lake Mendota is changing in ways that are not completely understood.
This year that data stream is especially important, explains Stanley, because the lake turned very green, very early. “We have a long-term record of different types of zooplankton in Lake Mendota and we know that right now we are seeing no Daphnia – the big, fat zooplankton that like to eat algae, keeping algal blooms in check.”
Because the Daphnia are at historically low levels this year, Stanley is certain that an invasive zooplankton that appeared in Lake Mendota about five years ago is eating them, creating a friendly environment for algae growth and causing the lake to turn green.
This invasive zooplankton, the spiny water flea, first appeared in the Great Lakes some 20 years ago, carried into the waterway on ships from Asia and Europe. Scientists are concerned about its impact on water quality because it preys on the Daphnia that help keep the lake water clear by eating algae.
Algal blooms can deplete the oxygen in the water, and the film that forms on the surface reduces the sunlight that plants and other organisms need to live, disrupting the balance of the system. Many of these blooms are harmful to people and the environment.
Lake Mendota is perhaps the best-studied lake in the world. The home of North American limnology, the university has samples dating back to the early 1900s, making Lake Mendota an ideal place to document the before and after effects of invasive species.
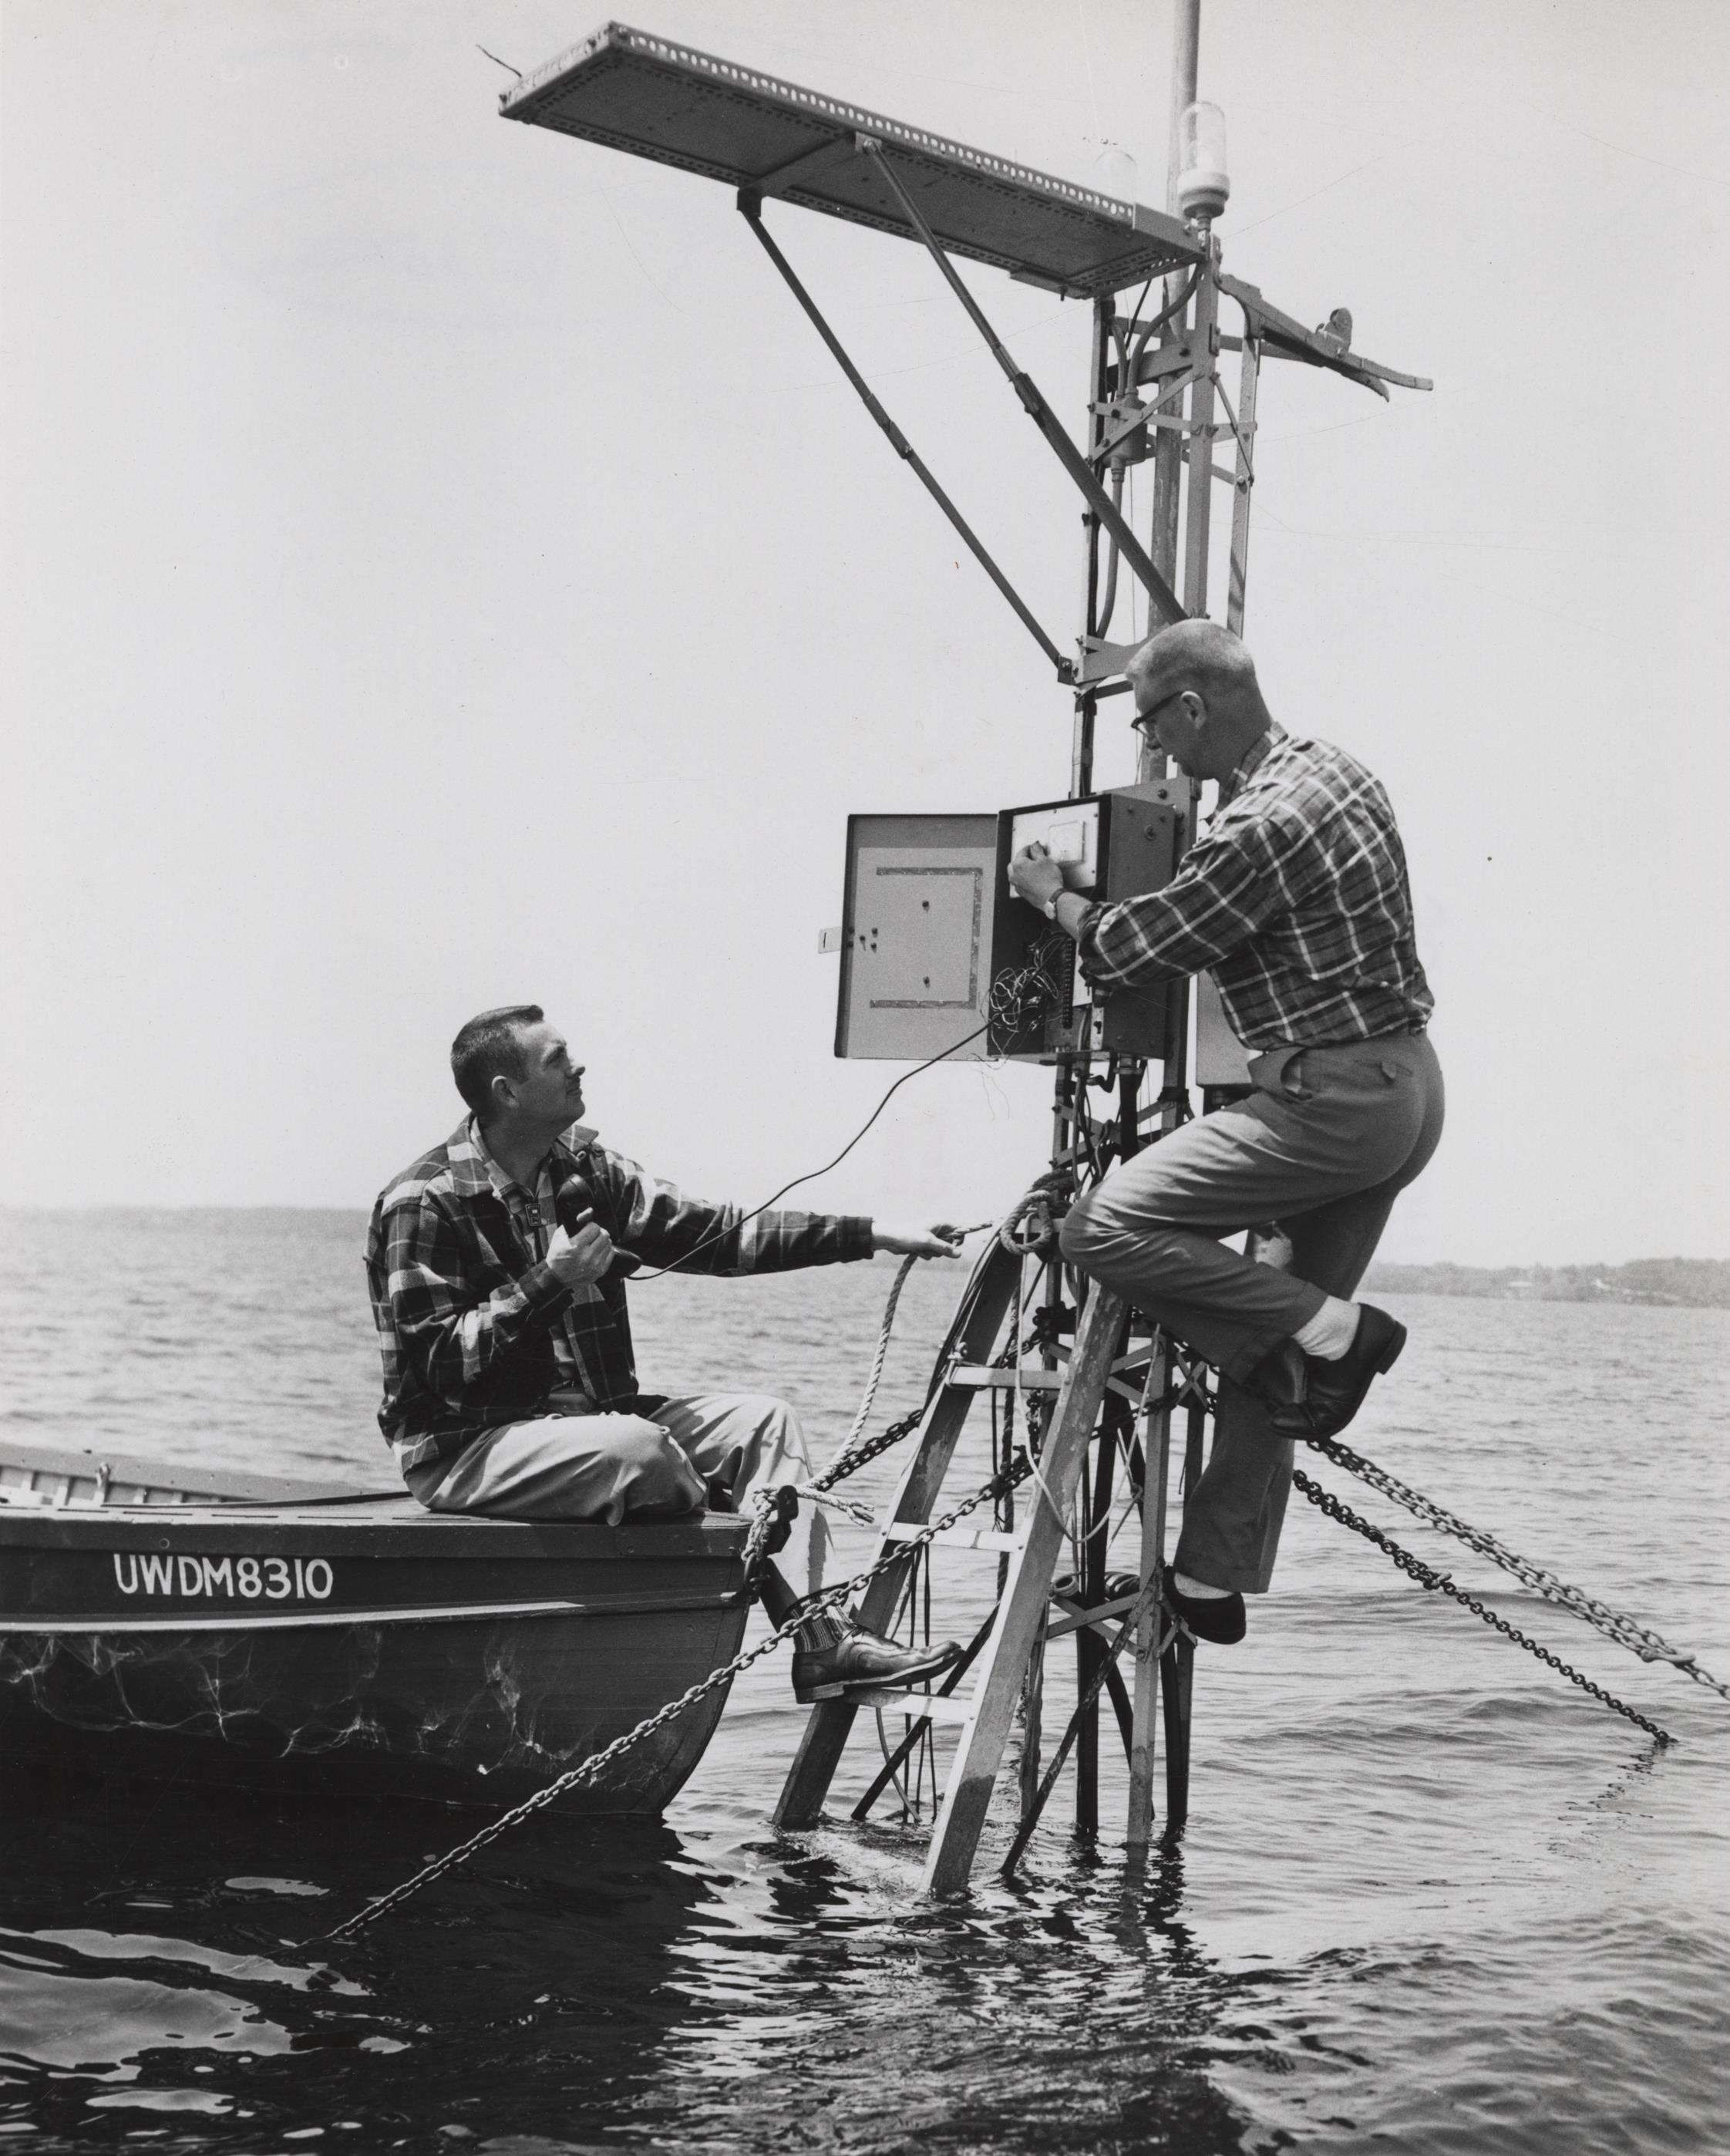
Reid Bryson (left) and Charles Stearns (right) of the UW-Madison Department of Meteorology measure Lake Mendota temperature, 1960. Credit: University of Wisconsin News Service, Madison, WI.
On the meteorological side, the late professor Reid Bryson who established the UW Department of Meteorology in 1948 tapped into the lake data collected by limnology colleagues, and further contributed to the study of Lake Mendota by installing the first buoy in 1959 in order to collect micrometeorological data.
That earliest buoy, located off of Second Point, was really more like a tower anchored to the lake bottom. It was subject to the whims of waves and weather, but successfully provided data that supported the dissertations of meteorology students.
Both Stanley and Thom are excited about a burgeoning partnership with the Clean Lakes Alliance, trying to link the buoy data to citizen monitoring around the perimeter of the lake: More data on water clarity and quality combined with buoy data will improve water quality forecasts and the ability to develop measures to try to ensure the health of the lake.
Now in its third year, Lake Mendota citizen monitoring is emerging as a way to support scientific research but also as a way to raise public awareness about and advocacy for challenges facing our lakes.
While the buoy collects samples from the middle of the lake at frequent intervals, trained citizen scientists collect near-shore samples at less frequent, but regular, intervals, says Justin Chenevert, Watershed Engagement Intern with the Clean Lakes Alliance and UW-Madison graduate student.
“Since most people interact with the lake near the shore – at beaches, for example – they are very interested in what we are doing; asking questions about our monitoring protocols and where the data is going,” says Chenevert.
Citizen scientists take a number of measurements from piers or beaches. One of them is turbidity, a measure of water transparency based on the presence or absence of particles in the water: A higher number means water clarity, and, conversely, a lower number means that particles are blocking the passage of light, making the water murkier.
“We’ve seen a shortened clear-water phase in Lake Mendota this year, based on overall reporting,” says Chenevert. “While we don’t monitor for organisms, what we’ve seen this year is consistent with this theory of low Daphnia.”
Volunteers at 50 sample sites also submit wind and water temperatures as well as some visual observations: Are there any identifiable algal blooms; are there water fowl on the beach; are there plants visible in the water; are there waves?
All of these data are publicly available through Lakeforecast.org. The Clean Lakes Alliance developed this mobile-ready website in partnership with MIOsoft, the Center for Limnology, SSEC, the City of Madison, and Dane County to provide near-real-time lake conditions for lake users.
Wind data is another important metric to collect because it is being used to develop seasonal algae projections to try to predict where and how wind- or current-driven algae will move over the course of a season.
With the buoy as a benchmark, the data contributed by citizen scientists will help construct a realistic picture of the complexities of Lake Mendota conditions over time.
“No good ideas stay in one place; they go everywhere,” says Stanley, “and I think the collaboration with SSEC and the Clean Lakes Alliance is a great example of the Wisconsin Idea in action. Because of the success of this collaboration, there are plans in the works to deploy a buoy in Lake Monona, to further expand our dataset and to try to develop solutions to our lake and watershed problems.”
It’s a great example of how a program developed to support university research can provide an important public service, adds Stanley.
by Jean Phillips