Improving probabilities: Predicting severe weather in the GOES-R era
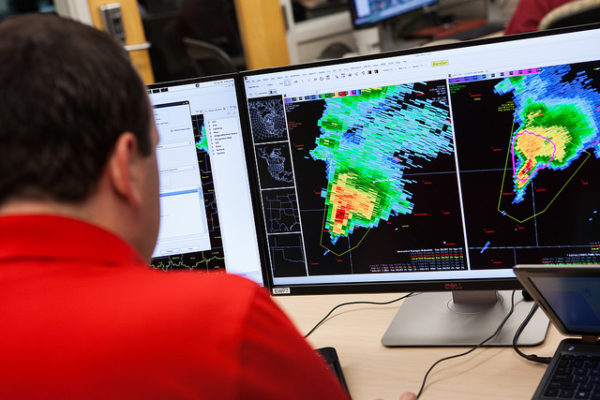
A forecaster utilizing ProbSevere at NOAA’s Hazardous Weather Testbed. Photo credit: NOAA/NSSL.
With the launch of GOES-R coming later this month, scientists at the Space Science and Engineering Center (SSEC) and the Cooperative Institute for Meteorological Satellite Studies (CIMSS) are looking ahead to improvements that will be possible with higher resolution GOES-R data. As a start, higher resolution data means more frequent data and imagery with much more detail than the current geostationary weather satellites can provide. The increased frequency and detail is crucial for improving the accuracy of severe weather forecasting.
Mike Pavolonis, a NOAA Advanced Satellite Products Branch (ASPB) scientist stationed at SSEC/CIMSS, leads a team of researchers who have developed a statistical storm-prediction model. This model, known as ProbSevere, is now in use at National Weather Service forecast offices across the country and making a difference in severe weather warning operations. Pavolonis recently discussed how the model works and is used by forecasters, as well as the advances that will be possible with GOES-R data and promising new avenues of research.
Let’s start with the development of ProbSevere. Why don’t you describe how you came up with the concept for ProbSevere and what it does to help forecasters?
So the history goes back to about 2007. We were first looking at how to better utilize retrieved cloud properties from satellites for severe weather applications. In other words, going beyond qualitative usage and actually deriving physical parameters. And [looking at] how they evolve in time and how they relate to the severity of thunderstorms.
We realized satellites offered an awful lot, but couldn’t solve the problem entirely. Radar is a primary tool for severe weather warning operations so bringing in the radar made a lot of sense. Understanding the background atmospheric state also made a lot of sense. So that’s where we brought in numerical weather prediction model data, very short-term forecasts that capture the dynamics and thermodynamics of the background atmosphere and how conducive it is for severe weather. Then later on came lightning measurements, which from the ground had become more plentiful and available, and it made a lot of sense to incorporate those data as well.
We have all these different data sets and when you add up all those data sets it’s a very large volume. Forecasters, given the time constraints they are operating under, they can’t possibly interrogate all those data to the extent that they want to in real-time and do their job. And so the idea of ProbSevere is to integrate all those data and transform them into relevant, actionable information. There’s a big difference between data and information. The idea is to transform the data into information and relay it to forecasters in a format that’s easy to understand and can easily be integrated with their existing procedures, like interrogating radar data.
ProbSevere evolved into a very simple product in the end. It’s just a probability value for each developing thunderstorm captured by standard radar imagery, and forecasters can optionally interrogate all of the parameters that were used to derive the probability. Every hour ProbSevere transforms over a gigabyte of data into a few kilobytes of information. It’s distilling the firehose of data. That firehose is already a bit intimidating and large. But now as we transfer over to the GOES-R era, it’s going to increase by close to a factor of 10. So it goes from being challenging to completely unmanageable.
And it’s not only about distilling the data down, but it’s also about making the most of the assets. GOES-R offers an awful lot more in terms of how frequently it takes images, the spatial resolution of those images, and then what spectral frequencies you are actually measuring. All of those things have gotten better. And so if we truly want to take advantage of them, you have to go beyond the visual interrogation of the imagery. Imagery will always be very useful but you have to go beyond that to take full advantage of the measurements. Part of what ProbSevere is doing is working towards getting maximum value out of these measurements. In addition to distilling the large data volume down, it’s already ensuring that we are getting the most out of this capable asset.
Who else is collaborating on ProbSevere and what are their roles?
John Cintineo does most of the hands-on work. John came to CIMSS after completing his Master’s degree at the University of Oklahoma, where they specialize in radar. So he was a natural to dig into this project and make it his own. When John came on board in 2011, that’s when we really started putting more of the pieces together. His radar expertise played a very significant role in that. Justin Sieglaff, who has quite a bit of experience doing severe weather research on other projects, also is a significant contributor to this project, from his expertise in doing the cloud-top cooling product.
I think of it as building upon all of the previous work for short term severe weather applications–building upon that heritage of the work that CIMSS started doing in the early 2000s. It’s a natural evolution of all that.
National Weather Service forecasters have had a chance to work with ProbSevere through the Hazardous Weather Testbed. What has been their response and what sort of feedback have you gotten?
ProbSevere has been evaluated for the last three Hazardous Weather Testbeds. Each time the reviews have been predominantly favorable. We always ask the question: if this tool were available in your weather forecast office for severe weather warning operations, would you use it? And each of the three years close to 99% of forecasters say yes to that question. Forecasters have a tough job and as a result they are hard to impress. So that response, skewed that much toward the favorable end, is quite rare.
But ProbSevere is not perfect. We’ve gotten plenty of constructive criticism on things that they would like to see it do that it doesn’t do right now. There are certain environments in which ProbSevere struggles to forecast which storm will be severe. And so they would like us to do a better job of determining which storms will be severe in all environments, not just most of them. That’s where a lot of our current work is focused, and we’re optimistic that we’ll make progress. That’s really been the primary criticism; we’ve had minor suggestions here and there, for example related to the display. Our research has been in response to that need.
Have other forecasters evaluated ProbSevere outside of the Hazardous Weather Testbed and what have you learned from their experiences with the model?
Right now, it’s pretty much in every NWS weather forecast office in the lower 48. We’ve moved beyond the Hazardous Weather Testbed stage into more of an operational assessment. We’ve gotten good feedback from that. We know that a lot of offices utilize it in severe weather warning operations. This is a new tool for them and so there’s a lot of discussion about how you weight the different pieces of information that are coming at you, including ProbSevere. As a result, there is a learning curve that is going on right now.
Put it this way, if we stopped making it, if the forecasters stopped getting it, we would hear about it. We had a hardware outage at one point and it went down, and the next thing you know we’re getting a bunch of emails asking, “Where’s ProbSevere?” So that’s one of the signs that they care about it. If you take it away and they complain, you know they’re utilizing it and look at it in a favorable light.
How long have forecasters had access to ProbSevere and how have they learned how to use it?
Two years ago we gave the Milwaukee office access to it. Then a couple of other offices got it the year after that. But this is the first year where it’s virtually in every office in the lower 48. And that has to do with what version of the AWIPS software they had to visualize it. They now are all on a sufficiently current version of AWIPS so that they can all get it. This is the first year that that’s happened. We recently received feedback that many NWS forecast offices now routinely use ProbSevere in severe weather warning operations.
We’ve put a lot of effort into developing training materials. We have training material that a forecaster can get from our website at any time. We’ve also conducted many live training sessions with the various NWS regions where we’ll do a live version of the training material tailored to their geographic region. That’s been our primary mechanism. I think just about all forecasters have been exposed to it in some way, shape, or form, either through a live training session or offline exposure to our modules.
What sort of impact will GOES-R data have on the model and what sort of improvements do you expect to see?
One of the primary components of the model is the satellite component. So from the satellite what we’re able to see, prior to the radar being able to see, are the clouds developing in the early stages. Before you can see them on radar you’ll see the clouds evolve and grow. The tops get higher and higher. Ice also begins to form at the cloud top.
Now with GOES-R we’re going to have far more frequent measurements, so far more frequent images, and they’re going to be much higher resolution spatially. The combination of those two things will allow us to make a more precise characterization as to how those clouds are evolving in time. The end result will be greater accuracy of ProbSevere and greater lead time.
One of the goals is to not just pick out the storms that are going to be severe, but to do it with sufficient lead time that it adds value to the warning process. We want to be able to do something that gives lead time relative to what you can get from radar alone. So the satellite development part of that is what gives us most of the lead time. Right now with the current GOES, a typical lead time [using ProbSevere] compared to a radar only assessment is 10-12 minutes, which in severe weather warning operations is pretty significant. We think with GOES-R that will increase by at least a couple of minutes.
GOES-R also has the ability to see lightning which is a new capability for that orbit. We’ll be utilizing that as well so we expect some improvements through the use of the lightning capability.
How have you adapted the ProbSevere model to prepare for GOES-R data?
The model is a statistical model. So it needs to be trained on real data. It can be run on GOES-R data, but it’s not going to be optimized until it’s trained with real GOES-R data. During the post-launch checkout period, one of our activities will be to collect a sufficient volume of GOES-R data and retrain the model so that it’s optimized. So that by the time GOES-R is declared operational [in late 2017], ProbSevere will be ready and optimized.
As you prepare for GOES-R, are there any additional improvements that you are planning for ProbSevere?
We’re trying to make the model perform equally well in all environmental states, but as part of that process we’re also looking to not just do the probability that a thunderstorm will become severe but the probability that it will produce a certain hazard.We’re doing probability of wind, tornado, and hail. These are all ongoing developments. And we’re involved in the Probabilistic Hazard Information (PHI) system being tested by the NWS [rather than simply showing areas where severe weather may occur, this new system breaks down each area into swaths that are color coded according to the probability of severe weather occurring].
Investigating how to make the most of weather satellite data–and creating products and models for forecasting–is a critical research area for SSEC and CIMSS scientists. In severe weather minutes count. Providing forecasters the tools they need to more accurately predict and alert the public to severe weather can save lives.
by Leanne Avila