Monthly News Summary – February 2002
Snow and Ice
by Terri Gregory, SSEC Public Information Coordinator
February 2002
This issue of In the News covers news and events mostly occurring in January 2002. Use images freely with credit to the Space Science and Engineering Center, University of Wisconsin–Madison. We’d appreciate a copy or notice when you use something.
Lake Effect Snow—The U.S. hasn’t been blessed with much snow this winter, so far. When it arrives, though, it can be memorable, especially when viewed courtesy of SSEC’s direct broadcast link to the MODerate-resolution Imaging Spectroradiometer. MODIS flies on board NASA’s Terra satellite, a polar-orbiting earth science satellite. With its high resolution abilities, MODIS shows great detail in clouds and snow coverage.
 |
This 1 kilometer image shows lake effect snows sweeping over Lake Michigan on January 17, with surface observations of temperature, winds and current weather overlaid. Newly fallen snow is visible over Wisconsin and northern Illinois. The MODIS data was collected around 16:50 UTC on January 17; the surface observations were taken at 17:00 UTC. |
According to MODIS team member Kathleen Strabala, “Lake effect snows form when cold air moves over relatively warm water. In this image, clouds begin to form about half way over the lake and spread eastward with the prevailing winds. Note how the air is modified as it passes over the lake, shown not only in cloud formation, but in an increase of temperature. Temperatures in eastern Wisconsin are in the teens. By the time the air reaches the east side of the lake, the temperatures have risen into the mid twenties.” This image uses MODIS Band 3, which is used for depicting land and cloud features and aerosols.
Heavy Snow and Ice—An unusually wide swath of significant snow cover resulted from a series of winter storms moving northeastward across the central United States from January 29–31. Snow fell across the Great Plains, Midwest, and Great Lakes regions, accumulating as much as 6 to 18 inches in each of the affected states. Along the southeastern edge of the heavy snow band, significant freezing rain resulted in a 1–3 inch coating of ice across parts of Oklahoma, Kansas and Missouri. This was one of the worst ice storms in Oklahoma history, downing 4000 electric power poles and causing loss of power to a quarter of a million homes and businesses. The translucent nature of this thick ice coating is quite evident on the MODIS true color composite image, in contrast to the brighter white appearance of the snow covered regions immediately to the northwest. (by Scott Bachmeier)
  |
The ice-covered region actually extends farther to the northwest than is noticeable in the top, visible image, but some of the ice-covered areas later received snow. MODIS has 36 usable channels. That means it can look at a scene in that many different wavelengths, enabling comparison and contrast to better see and analyze certain features. By comparing visible data (top) with data form the MODIS near-IR channel 6 (1.6 micrometer, bottom), one can determine the true extent of the ice-covered region, even the ice areas that are covered with snow. Ice is black in the bottom image. |
Imagery like this could help utility companies in remote regions know what areas are actually ice-covered, so that they could plan their recovery efforts accordingly. This imagery was used in NASA’s Earth Observatory Web site on February 5 and in the Web site of the National Weather Service’s Oklahoma Office.
Winter Forecasts—With significant winter weather across much of the United States in the last weeks of January, several National Weather Service (NWS) forecast offices reported finding the Wetzel Winter Ingredients-based Methodology (IM) to be useful in their forecasts. Comments (in NWS forecast talk, hence the capital letters) came from Arizona, Iowa and Wisconsin.
–THE QPV* AREA…WETZEL ET. AL….IS REALLY NAILING THIS AND HAS SINCE TUE [*QPV is possible heavy snow, perhaps accompanied by lightning and thunder]
–INITIAL LOOK AT ETA MODEL AND WETZEL INGREDIENTS SHOWS POTENTIAL OF ANOTHER ROUND OF HVY SNOW
–IN FACT…WINTER INGREDIENTS SHOW A BULLSEYE OF CONVECTIVE INSTABILITY ALONG THE NOSE OF THE DRY SLOT (OR JET) MOVE NORTHEAST INTO THE SYSTEM
 |
The true-color MODIS composite image (composed from three bands) from February 1, 2002, shows a swath of heavy snow across the midwest. Click on it for a large image in which you can see the ice along the southeastern edge of the heavy snow band. |
In December 2001, Scott Bachmeier (CIMSS) delivered the Virtual Institute for Satellite Integration Training (VISIT) instructional component, “An Ingredients-Based Methodology for Forecasting Winter Season Precipitation,” to 22 forecast offices of the U.S. National Weather Service and the Meteorological Service of Canada.
The concept of Ingredients-Based Methodology identifies the fundamental processes in a forecasting challenge and provides a systematic approach to analyze each one. Wetzel Seemann developed her technique specifically for winter precipitation, which is difficult to forecast precisely. The five key ingredients she uses are forcing for vertical motion, instability, moisture, temperature and efficiency. These and other research details are found in her thesis, freely available on the Web. The Cooperative Program for Operational Meteorology, Education and Training (COMET®) funded Wetzel Seeman’s research as fulfillment of degree requirements with the department of Atmospheric and Oceanic Sciences under Professor Jonathan Martin. COMET is operated by the University Corporation for Atmospheric Research and sponsored by NOAA.
AWS Program—UW–Madison’s Jonathan Thom (SSEC) and George Weidner (AOS) traveled far south this January, to Antarctica, where it was summer, with temperatures from about 0 to 30 degrees. They weren’t on vacation. Thom and Weidner are meteorologists, performing annual maintenance on UW–Madison’s network of Automatic Weather Stations, vital to forecasters in Antarctica and used world-wide. The harsh Antarctic winds wreak havoc even with these sturdy machines. Every year at least some of them must be checked in person. This year, the National Science Foundation, funding agency for U.S. Antarctic programs, taped their activities. Mark Buckley, multimedia supervisor in McMurdo, arranged the videotaping session for “general media purposes as well as stock file footage for our growing video library. There has always been strong media interest in weather related topics and footage.” Weidner reported that the taping took place at Minna Bluff, where this shot was taken.
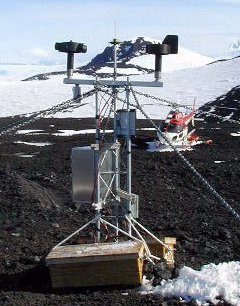
Notice the helicopter in the background. Weidner and Thom also kept a short journal while in Antarctica, for SSEC’s Office of Space Science Education.
B-15 free—The sea ice surrounding monster iceberg B-15 (shaped like a coke bottle in this image) finally broke up in January, deep into Antarctica’s summer. It was unusually thick this year, because iceberg B-15 and others shaded the area, keeping it much cooler than usual. All this made it impossible for penguins to reach normal feeding areas. Rookeries on the north side of Ross Island are devastated.
- BBC News, Search on Penguins
Splendid Developments
For more information
ADR Rides Again—In July 2001, NASA approved a new mission, Astro-E2, to replace the Astro-E spacecraft that never reached orbit in 2000. Like that first mission, Astro-E2 is a collaboration with Japan’s Space Science Agency ISAS and will be launched at Kagoshima, Japan in February 2005. This means that the spare Adiabatic Demagnetization Refrigerator (ADR) that SSEC delivered to NASA’s Goddard Space Flight Center a couple years ago will be used as the final stage of the cooling unit in the X-Ray Spectrometer (XRS), the Astro-E2 primary instrument. The XRS is a new generation of X-Ray Spectrometer that will measure the spectrum of celestial objects in the “soft” X-ray range (200 to 10,000 eV), at a much higher resolution than has been possible up to now. SSEC’s ADR crew (primarily Dave Jones and Tony Wendricks) will fabricate a new spare ADR salt pill this year.
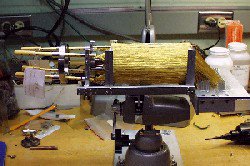 |
ADR salt pill being manufactured. Click for another view. |
The ADR is what keeps the XRS detectors cold enough to work. Overheating means death to the mission. The ADR is a complicated little refrigerator. At the heart of the ADR is the salt pill, fabricated by SSEC, that works inside a liquid helium bath to keep the XRS cold, at temperatures close to absolute zero. When successfully placed into orbit by ISAS, the ADR will become the “coldest known manmade object in space”!
AniS—Directions for the popular Java applet, AniS (for AnimationS), have been translated into Spanish for meteorological use by Francisco Martín León of Servicio de Técnicas de Análisis y Predicción (STAP). León also has formed a Spanish AniS Club. AniS makes it possible to animate all sorts of data in many ways, including looping and zooming in satellite imagery. It enables overlays, fades, toggles and portals. The software, developed out of work done for the Virtual Institute for Satellite Integration Training, is available free on the Web. It is used widely, including by the National Weather Service, to animate radar loops.
McIDAS Services —States News Service reported on January 24 that “University of Wisconsin’s Space Science & Engineering Center, Madison, won a $330,556 contract from NASA’s Langley Research Center, Hampton, Va., for man-computer interactive data analysis system [sic].” The multi-year contract for McIDAS services and data was published in a list of federal contracts of more than $100,000 awarded to Wisconsin organizations.
Weather Research
GOES-9 Sample Imagery—Until recently, the Geostationary Operational Environmental Satellite GOES-9 was being stored in orbit. In November 2001, NOAA reactivated it to test as a possible replacement for a Japanese satellite. Tim Schmit, Paul Menzel and Gary Wade, all NOAA personnel stationed at SSEC, and Jim Nelson (CIMSS) presented imagery from the satellite that summarized its current performance. The quality of the radiances from both Imager and Sounder instruments was addressed, along with several products (retrieval profiles and cloud information) derived from Sounder data. The main limitation of GOES-9 is high frequency oscillation in the Imager full-resolution visible band; yet overall, the meteorological information remains good. A sampling of data products and imagery is available on the CIMSS Web page.
The imagery is provided for every hour on January 16, 2002. Types of data from the Sounder instrument include derived product imagery (DPI) of total precipitable water, lifted index (stability), and cloud-top pressure as well as displays of radiances from all 19 spectral bands. Hourly Imager data include representative visible and infrared “window” images that were used for quick but routine monitoring during the testing period. GOES-9 was launched in 1995 and put into storage in 1998 because of a mechanical problem. SSEC, which houses the U.S. national archive for geostationary weather satellite data, was the only organization to receive the data for analysis.
GOES-12 Tests—Jim Nelson has showed that the newest U.S. geostationary satellite, GOES-12, should produce more accurate retrievals of total precipitable water than older satellites GOES-8 and GOES-10. Total precipitable water is the amount of water vapor that could condense into rain above a given point on earth. Looked at more simply, it is how deep a puddle of water you’d stand in if all the water vapor over your head would become rain. Using data from October 8, 2001 through December 16, 2001, GOES-12 measurements were approximately 0.5 mm (millimeters) closer to radiosondes (measurements from weather balloons are accepted as truth) than GOES-8, and 0.25 mm better than GOES-10.
GOES for Europe—The European Centre for Medium-range Weather Forecasts (ECMWF) is monitoring an experimental GOES product produced by Tim Schmit (NOAA) and Tony Schreiner (CIMSS). Preliminary results of Clear Sky Brightness Temperature data are positive. The ECMWF plans to monitor the data operationally by the end of January 2002. The next step, which has already begun, is assimilation experiments. The Environmental Modeling Center of the U.S. National Centers for Environmental Prediction is also bringing the experimental GOES Imager clear-sky brightness temperature information into their operational data tanks, although the data are not yet being assimilated.
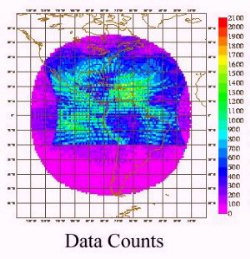 |
Color-coded density of the GOES Imager observations. “Warm” colors are regions of more observations. Note that the region near the US is sensed more often than elsewhere. |
GOES Work—The CIMSS group devoted to GOES satellite applications has parameterized (measured precisely) surface emissivity for a set of experimental data retrievals. These retrievals, which included the effects of surface emissivity (along with several other changes) were compared to those generated with the routine GOES algorithm. Results showed that the retrievals with the experimental algorithm were slightly improved (for most vertical levels) over the routine retrievals, where surface emissivity effects are treated less rigorously. These results confirm the notion that surface emissivity must be accounted for, especially in climate and weather forecast models, because surface attributes affect atmospheric temperature and moisture. The verification consisted of 1291 radiosonde/retrieval comparisons for the months of May and June 2000. (Gail Bayler, Tim Schmit, Youri Plokhenko, Paul Menzel)
To delve more deeply into this topic, look up the Journal of Applied Meteorology, volume 40, pages 556-567, for a paper by Youri Plokhenko (CIMSS) and Paul Menzel (NOAA) on the mathematical aspects of meteorological processing.
CRAS—Robert Aune (NOAA, at SSEC) has begun using the Interactive Multisensor Snow and Ice Mapping System snow cover product generated by the Satellite Analysis Branch of NOAA’s National Environmental Satellite, Data, and Information Service, a different branch from that collocated with SSEC’s Cooperative Institute for Meteorological Studies. SSEC’s local group is theAdvanced Satellite Products Team within NOAA’s Office of Research and Applications. The product was assimilated into the CIMSS Regional Assimilation System (CRAS), replacing an older product that was generated by NOAA’s Climate Prediction Center. Preliminary results indicate that the product maintains good time continuity and, at 25-km horizontal resolution, does a good job of delineating snow/no-snow edges. A corresponding improvement in forecasts of low-level temperatures is expected.
NCEP—Jim Jung (CIMSS, stationed at NOAA’s Science Center near Washington, D.C.) wrote and delivered a cloud assimilation routine to the National Centers for Environmental Prediction (NCEP). Jim discussed with NCEP’s Mesoscale Modeling Team the incorporation of the GOES cloud product into the regional Eta Data Assimilation System (used by the National Weather Service). Jim also delivered the software changes to the EDAS that are required to test the cloud assimilation. NCEP will complete final testing and implementation.
Biomass Burning Monitoring—As part of their ongoing collaboration with A. Setzer of Brazil’s Instituto Nacional de Pesquisas Espaciais (INPE), Joleen Feltz (CIMSS) and Elaine Prins (NOAA) compared GOES ABBA fire products with fire products developed by INPE with data from NOAA’s Advanced Very High Resolution Radiometer (AVHRR) for the past seven fire seasons (1995-2001). Results show that the INPE AVHRR fire product detects more fire pixels in a single time period than the GOES-8 ABBA at that same time period, especially in the Cerrado (grassland) region where the fire intensities are generally lower than those observed in forested regions. When comparing diurnal ABBA composites with INPE’s daily fire product, the GOES-8 ABBA typically detects 2 to 5 times as many unique fire pixels. This demonstrates the importance of high temporal monitoring to capture agricultural burning in South America where the fire signals are often detectable by satellite for only a few hours. The AVHRR instrument rides on NOAA’s polar orbiting satellite, which passes over the same spot on Earth only twice daily, while the GOES satellite sees the same spot on earth continually from its place in geostationary orbit.
FLAMBE—Researchers Elaine Prins (NOAA) and Chris Schmidt (CIMSS) are providing fire products every half hour for the FLAMBE project. An ongoing collaborative effort, FLAMBE exists “to model biomass burning emissions, transport, and radiative effects in a global prognostic meteorology model.” The model is run at the Naval Research Laboratory, currently using half-hourly fire products generated with a wildfire algorithm developed at CIMSS by NOAA and CIMSS researchers, directed by Elaine Prins. Other collaborators besides the U.S. Navy include NASA, NOAA and the University of Alabama. Limited currently to the western hemisphere, the investigators hope to cover the globe. A poster titledThe Fire Locating and Modeling of Burning Emissions (FLAMBE) Project, authored by J. Reid et al., was presented at the Fall 2001 AGU meeting and provided an overview of this interagency effort that integrates remote sensing fire products into transport models in real time for monitoring and predicting burning emissions and transport.
Polar Clouds—Jeff Key (NOAA Team Leader at SSEC) and colleagues have upgraded the experimental near real-time Web product that provides retrievals of polar surface, cloud and radiative properties from the AVHRR instrument on NOAA’s polar-orbiting satellite. The product has been upgraded from a developmental version to a stable release (version 1.0).
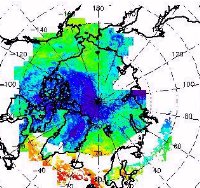 |
An AVHRR product showing downwelling longwave flux |
CASPR—Jeff Key has also released a new version of the Cloud And Surface Parameter Retrieval (CASPR) system for the Advanced Very High Resolution Radiometer instrument. CASPR is intended for use with high-latitude data, and contains procedures to estimate surface temperature and albedo, cloud amount, particle phase and size, optical depth, temperature, and both surface and top of the atmosphere radiative fluxes. The new version has improved cloud detection, support for the NOAA-16 AVHRR/3, additional output formats, and many other improvements.
Polar Winds—Lars Peter Riishojgaard of NASA’s Data Assimilation Office (DAO) reported that the DAO is seeing a distinct positive impact of satellite-derived polar winds on model forecasts. Scientists Jeff Key (NOAA) and Chris Velden and Dave Santek (both of CIMSS) provided a 10-day case study of cloud-track and water vapor winds from the MODerate-resolution Imaging Spectroradiometer (MODIS) to the DAO. Riishojgaard also reported that the MODIS winds-minus-forecast metric indicates a “fairly dramatic impact,” especially for water vapor winds, and especially in the mid-tropospheric part of the atmosphere.
MODIS Research—Kathleen Strabala (CIMSS) has used data from the MODerate-resolution Imaging Spectroradiometer (MODIS) to simulate a pseudo-true color geostationary image. She created a composite that includes a blue channel, which also is being considered for the Advanced Baseline Imager (ABI) on the next generation geostationary satellites. According to Strabala, most satellite instruments don’t carry the three very narrow red, green and blue channels (wavelengths) required to produce natural-looking or “true” color. MODIS provides not only those three channels (and many others) but does so in high resolution and globally in a reasonable time period. The addition of the blue channel on the geostationary ABI would allow the creation during the day of pseudo-true color full disc images (images of a face of the globe from north to south poles) at regular intervals (in addition to visibility products).
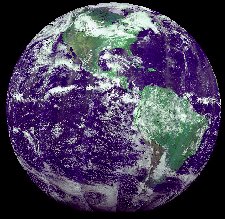 |
Click on the small image for a composite of simulated Advanced Baseline Sounder data in GOES projection. The image was generated with SSEC’s Man computer Interactive Data Access System using 2 days (3-4 June 2001) of MODIS global data, channels 1, 2 and 3 (red, green, blue). |
Broadcast
Tropical Cyclones—Chris Velden, leader of the CIMSS Tropical Cyclones group, was featured in a Discovery Channel program on Hurricane Floyd that aired January 23. The program will air again on March 4 at 10:00 p.m. and 2:00 a.m. The show, one in the series, Billion Dollar Disasters, related the story of the hurricane from both a scientific and human interest perspective. Chris Velden gave a concerned scientist’s perspective in the first 30 minutes and at the end of the show, commenting on atmospheric weather aspects. He and Gary Wade were shown discussing the storm at a computer prominently displaying McIDAS. Hurricane Floyd, “a storm the size of Texas,” dumped an ocean of rain on an already saturated part of the southeastern U.S. Commenting on the evacuation decision, Chris noted that hurricane forecasts must “rely heavily on probabilities” to account for the many factors making a storm dangerous, especially light upper winds, abundant warm water, and a well-developed storm structure. Joanne Simpson, Chief Scientist for Meteorology in the Earth Sciences Directorate at NASA’s Goddard Space Flight Center wrote, “That was the best hurricane film we have seen in some time,” giving Velden kudos for hitting “the level of the audience perfectly without sounding patronizing.” She also found the photography on Floyd and attendant flooding “just terrific.”
Edmund Fitzgerald—Lyle Stewart, of Radio Canada International, a service of the Canadian Broadcasting Corporation, contacted Steve Ackerman, CIMSS director, for an interview. In Stewart’s words, “As part of our regular program Maple Leaf Mailbag, we answer ‘burning questions’ from our regular listeners. Some have inquired about the origins of the song ‘The Wreck of the Edmund Fitzgerald,’ and whether the saga is a true story. Having read your informative Web page on the sinking, I was hoping I could conduct a short telephone interview with you about the incident, and how it has passed into the lore of popular culture because of the popular song by Gordon Lightfoot [Canadian singer/songwriter].” Ackerman wrote the piece, describing weather conditions when the ore ship sunk in 1975, with John Knox, then professor in UW–Madison’s Department of Atmospheric and Oceanic Sciences, as is Ackerman. Stewart said the piece will be posted on the Web by Monday, February 11.
Weather Guys Professors Steve Ackerman (also CIMSS director) and Jonathan Martin appeared on Larry Meiller’s WHA radio call-in show Monday, January 28. As always, they and their callers covered a variety of topics, mostly relating to Wisconsin’s weather and climate. Weather questions included, what weather conditions cause migraines?—a change in temperature, generally warm; what atmospheric conditions are necessary for green flashes?—refraction requires differing temperature structures, a long path and the right atmospheric structure. These uncommon occurrences are seen most easily over water. Topics also included rolling snow, rings around the sun, the infinite variety of snowflakes and their dearth this year in comparison with other years, winter droughts, ice age periods, and lightning and thunder in winter storms. You too can learn about weather in all its myriad forms on the last Monday of almost every month. Wisconsin listeners can tune into 970 AM, or 90.7 FM (if you can get the Delafield station). Or, listen in on the Internet. Click on Live Ideas Network Webcast. February’s broadcast is on the 25th at 11:45 a.m. Central Time.
Madison’s WMTV, channel 15, interviewed Steve Ackerman on January 2 for a spot on wind chill. The formula that weather forecasters used has changed this year and the reporter was concerned that people understand it correctly. Steve explained the new guidelines succinctly.
In Print
SSEC Composites—The German scientific publisher, Spektrum Akademischer Verlag of Heidelberg, will use SSEC’s global montage (colored Mollweide) on the cover of the text book, Physische Geographie (Nature of Environment). The book is to have been published in January 2002 with a print run of 6000 copies.
AWS—Watch for the March 2002 issue of Jack and Jill, the long-lasting educational children’s magazine. It will contain a “very brief sidebar” on the Automatic Weather Station program, directed by Emeritus Professor Chuck Stearns. Jack and Jill bases its piece on a University Communications release on SSEC’s Antarctic projects, especially the AWS program.
Wilt Sanders, SSEC senior scientist, and Karen Schwarz, will present “Living on Soft Money: Facts of Life” on Tuesday, April 9, at Union South. The Madison Academic Staff Association announced the talk, a MASA Brown Bag Information Session, in MASA News for February 2002.
On the Net
Precision Agriculture—In three to five years, farmers could have access to a tool that will help them make decisions that “increase their yields and control runoff.” Christine Molling presented research that SSEC is doing with the College of Agriculture and Life Sciences’ soil science department at the 2002 Wisconsin Fertilizer, Aglime & Pest Management Conference in Madison. The tool being developed is a numerical model that enables farmers to make informed decisions on crop management. It purports to answer the question, “What is the best way to manage agricultural land to maintain yield and minimize production costs?” A University Communications article stresses fertilizer decisions; the model actually “can simulate varying soil moisture and temperature and crop status caused by variability in topography and soil in a single field.” Molling and her colleagues are now seeking a company to help them create software for a farmer to use. “Entering the data into the system is the biggest problem right now, so we want to work on making it more user-friendly,” Molling explained. The research was reported in theWisconsin Week Wire, January 23.
AMNH— The American Museum of Natural History (AMNH) in New York is using “Rotation of Neptune,” produced by Larry Sromovsky and Pat Fry, in its new Astrophysics Visualization Archive. The Department of Astrophysics and the Hayden Planetarium at the AMNH has created this node of the Virtual Observatory to archive astrophysics visualizations. Sromovsky assembled the images from those taken by NASA’s Hubble Space Telescope and Infrared Telescope Facility at Mauna Kea, Hawaii. The AMNH Web site gives Sromovsky’s brief summary of what is known about Neptune’s atmosphere.
Contour Mapping—A new Earth Science teacher in New York State calls Steve Ackerman’s site on contour mapping (with Tom Whittaker’s Java applet) “a wonderful resource.” She says that her 9th grade meteorology class “can practice at home as well as in the Computer Lab here in school.”
Education and Outreach
GLOBE, India—Sanjay Limaye, SSEC’s outreach director, visited New Delhi, India to help educators and scientists from India, Thailand and Nepal develop their GLOBE program. The 7-day international training workshop focused on protocols of the Global Learning and Observations to Benefit the Environment program. R. Mehta, Director of India’s Ministry of Environment and Forests said, “GLOBE provides a wonderful opportunity to school children and communities to learn science through a hands-on participatory approach.”
V.E.Suomi—A videotape clip of Professor Verner Suomi is found on a CD used in the COMET program to train new meteorologists in the interpretation of satellite imagery. NCAR made the tape in 1995 to promote SuomiSat, which uses GPS signals to make meteorological measurements. In the clip, Professor Suomi explains the orbits of the two primary weather satellites—polar, or low earth orbiting, and geostationary orbits. You can see the tape at the bottom of the page dedicated to Professor Suomi, the founder of the Space Science and Engineering Center and the father of weather satellites, at the Suomi Virtual Museum.
SSEC’s Office of Space Science Education has organized a guest lecture series for West High School science students. First in the series is Astronomy Professor Edward Churchwell who will speak on “Formation of the Solar System.” Faculty in Space Physics and Astronomy will complete the series. OSSE director Sanjay Limaye said he will give a workshop this summer to help other schools beginning courses in the space sciences.
Honors
Johnson Award—Dr. Jun Li, a research scientist in SSEC’s Cooperative Institute for Meteorological Satellite Studies (CIMSS), is the 2002 recipient of the David S. Johnson Award. David Johnson was the first Administrator of NOAA’s National Environmental Satellite, Data, and Information Service (NESDIS). The award is given annually by the National Space Club “to young professionals who have developed an innovative use of Earth observation satellite data … that is, or could be, used for operational purposes to assess and/or predict atmospheric, oceanic or terrestrial conditions.” Li has helped to guide many weather satellite programs, supporting important goals in evaluating and enhancing the polar and geostationary operational environmental satellite (POES and GOES) remote sensing programs. His projects include development and implementation of several products from the current GOES sounder and future high-spectral resolution sounders, the development and evaluation of combined POES/GOES retrievals, algorithm development for the MODerate-resolution Imaging Spectroradiometer (MODIS) instrument, and cloud classification studies. In accepting congratulations, Li gave credit for the award to colleagues in CIMSS, especially the GOES and MODIS groups. The award, a plaque, will be presented in March 2002 at the annual Goddard Memorial Dinner, held near Washington, D.C., and hosted by the National Space Club, a non-profit corporation whose membership includes representatives from industry, government, education and the general public.
Meetings
AMS—The 2002 annual meeting of the American Meteorological Society played not only its traditional role of forum for atmospheric and oceanographic scientists to present their work, but also emphasized the role of the Society in helping the public. The meeting, held in Orlando, also included the first student meeting and career fair as well as the first Weatherfest, a three-hour science and weather fair for the local public. Of about 700 people attending Weatherfest, 500 of those were from the general public. The conference also held the second presidential forum, focused on the relationship between the AMS and the larger society. Two panels of experts discussed the needs of society for the services of atmospheric science, including CNN science correspondent Ann Kellan, who stressed the need for increased communication of scientists with the media, to keep the public aware of developments. She used the 1997 El Niño event as an example of good scientific communication with the public through the media. At the conference, SSEC talked with a fistful of media representatives interested in atmospheric science, including Kellan, Tom Skilling (Chicago’s WGN meteorologist), Sid Perkins (Science News) and Jack Williams (USA Today).
Throughout the conference the Electronic Theater was presented by different groups, always presenting vivid imagery of interest to atmospheric scientists. One was hosted by Steve Ackerman with help from SSEC and CIMSS staff and considerable input from Bill Hibbard, Vis5D and VisAD creator. Indeed, all electronic theaters featured many examples based in Vis5D. Other SSEC images were used or referenced in the conference, usually without attribution, as though belonging to the atmospheric science community. In the GOES forum, the SSEC global montage was touted as the “future of meteorology.” The National Climate Data Center’s poster used two SSEC global composites.
SSEC and AOS staff gave a number of papers and posters. Donald Johnson, AOS emeritus professor and SSEC scientist, stressed the critical need for accuracy in forecast models. Dave Santek talked about the issues in measuring winds from polar orbit, Tom Zapotocny spoke on the impact of data on the NWS Eta model, and Steve Ackerman and Tom Whittaker presented two interactive Java applets to an audience of appreciative educators. Others spoke also.
At the UW–Madison booth, SSEC exhibited with hundreds of other companies and organizations. Many conference attendees stopped by to try out McIDAS-Lite, to talk about our research, and to ask about student and employment opportunities.
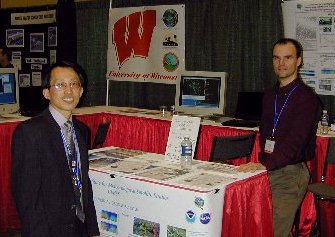 |
Allen Huang and Wayne Feltz in the UW–Madison booth at the 2002 AMS Conference in Orlando, Florida. Clicking on the small image shows the booth in greater detail. |
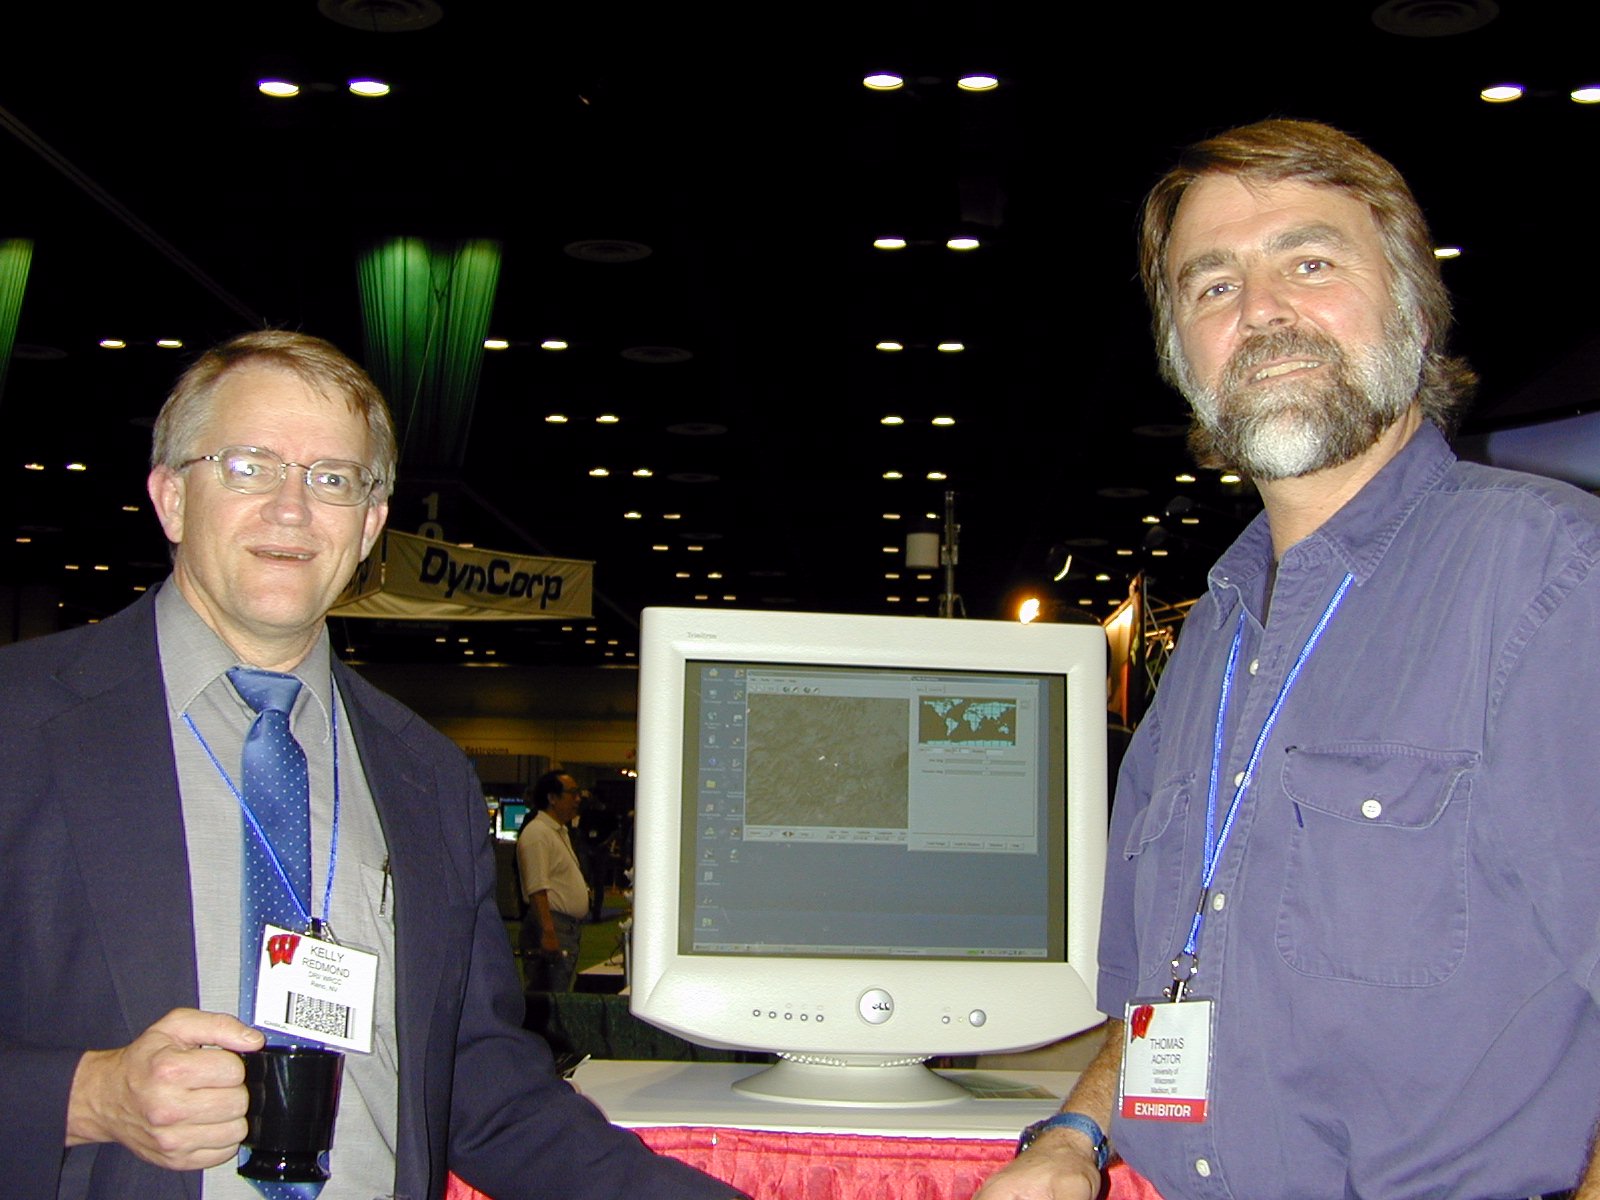 |
Tom Achtor shows McIDAS-Lite to Kelly Redmond, NOAA’s regional climate director for the western U.S. |
SSEC hosted an alumni gathering at a nearby restaurant, one with a suitably low-key atmosphere—we’re from Wisconsin, after all. Attending were 19 UW–Madison alumni, 4 current students and 3 AOS professors, plus an assortment of friends and colleagues.
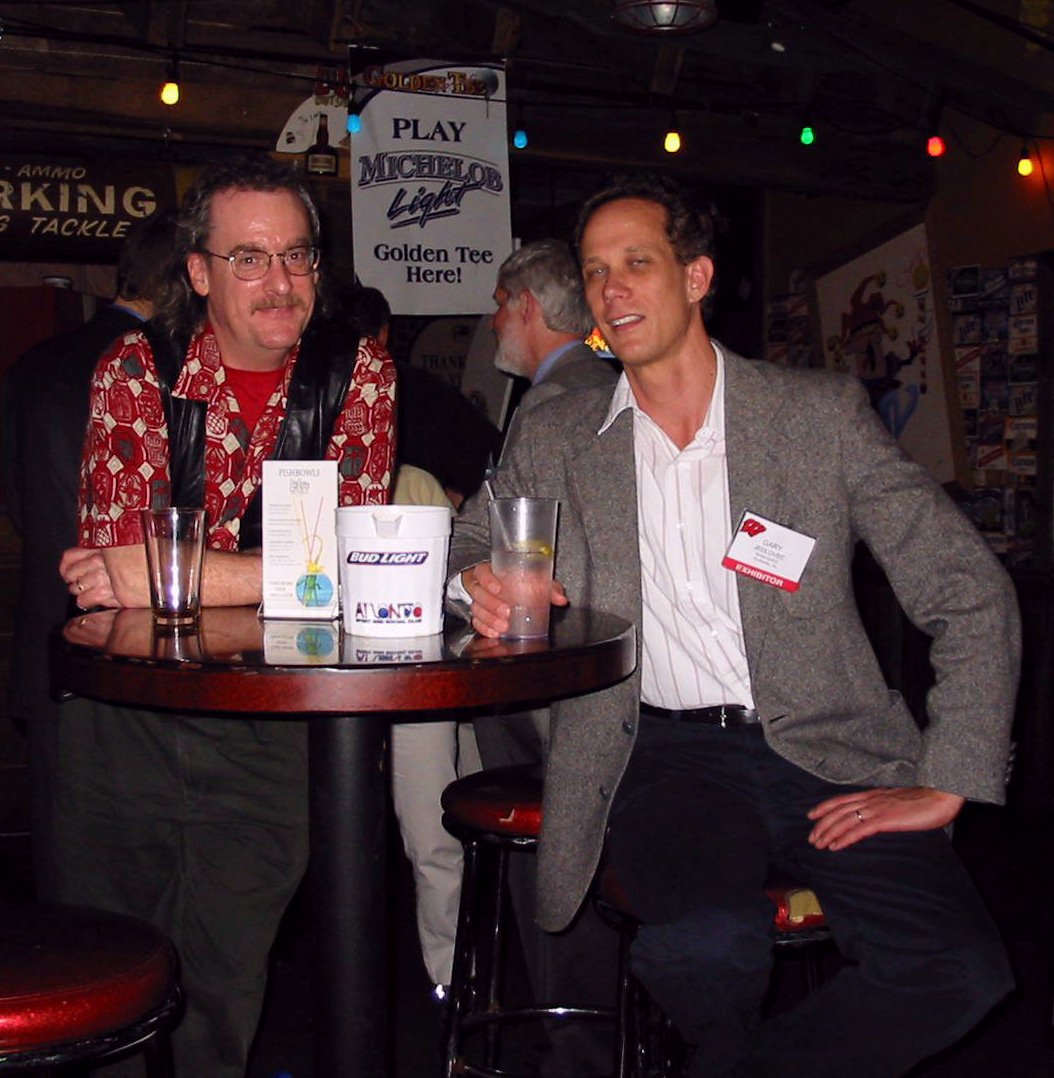 |
After a hard day meeting and exhibiting, Tom Whittaker, John Young (middle) and Gary Jedlovec relax at the UW–Madison get-together. |
Best quote from the conference, by John Delaney, geologist turned oceanographer: “Discovery is the seed stock of a culturally, educationally, and technologically alive society. Each generation needs some.” Contact the AMS if you want more information or a proceedings from this year’s meeting.