SSEC scientists join forces to visualize satellite weather data
Last summer, University of Wisconsin-Madison meteorologist Jordan Gerth was facing an obstacle.
The U.S. National Weather Service had selected him to train a group of meteorologists in Guam, a U.S. territory prone to tropical storms, on using satellite data for weather forecasting. The timeline was tight, because not only would the training need to cover the use of Himawari-8 (a geostationary satellite newly launched by neighboring country Japan) data, but it needed to lay the groundwork for using GOES-R, a U.S. geostationary satellite with nearly identical capabilities scheduled to launch in 2016.
Developing a hands-on course would require data visualization software. While several good options existed, Gerth worried that learning how to use an unfamiliar system could pose a barrier to entry.
“When we do a training, we don’t want to spend hours and hours teaching them how to use a tool. We want to train them on the meteorology,” he explains.
He decided that the best solution would be to develop a new, user-friendly visualization system — but doing so would require skills beyond his own expertise. So, in July 2015, he reached out to a colleague at the Space Science and Engineering Center (SSEC) — computer engineer Ray Garcia.
Gerth described to Garcia the types of features that he envisioned such a tool would need to have in order to be successful for the workshop. Above all, he says, the software had to have an intuitive and modern interface, user-customizable features, and quick loading times to handle large volumes of data.
Garcia signed on to the project as the lead programmer, and enlisted the aid of SSEC computer engineers Dave Hoese and Eva Schiffer to help with software development.
“They took it and ran with it, from a technical perspective,” recalls Gerth.
The development team spent several weeks examining different technologies: web applications, image-manipulation software like Photoshop, even game engines for video games.
“We wanted to know what’s out there, what’s available,” Garcia says.
They were ultimately drawn toward the simplest options, especially those that team members had used previously with other projects, such as SSEC’s Scanning High-Resolution Interferometer Sounder (S-HIS) instrument. OpenGL, a cross-platform application programming interface, was used for rendering 2D and 3D vector graphics, while Qt provided a framework for the software’s graphical user interface that could work across Mac, Windows, and Linux.
Using a scripting language, the team united these disparate components into one cohesive program: the Satellite Information Familiarization Tool (SIFT). And with SIFT, it seems the saying is true: the whole is greater than the sum of its parts.
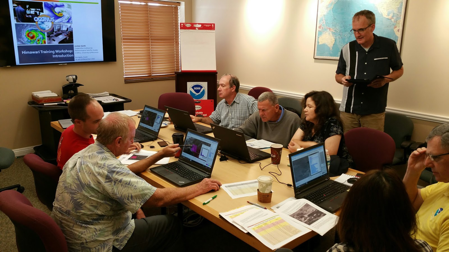
SSEC scientists Scott Lindstrom (standing) and Kathy Strabala (fourth from right) instructing meteorologists at the U.S. National Weather Service forecast office in Guam, 16-19 November 2015. Credit: Jordan Gerth, SSEC.
With the click of a button, SIFT opens up on a standard laptop or desktop computer. Once the user loads a batch of satellite data files, they can start exploring the imagery almost straightaway.
That was a key point, Garcia recalls. The instrument onboard Himawari-8, known as AHI, captures an image of Earth every 10 minutes, which is a lot of data for the average computer to process.
“When working with, typically, 100 gigabytes of projected Himawari data, [the user needs to] be able to push that from a solid state disk (SSD) into the graphics processing unit (GPU) very quickly,” he says. “We are taking advantage of hardware that didn’t exist five years ago — you can get a mid-range laptop [now] that has a very fast SSD and decent GPU capability — to move data efficiently.”
Once everything is loaded, there is virtually no time lag, says Gerth. Even with a gigantic image — one pixel could represent half a kilometer, for example — the user can pan around the image, zoom in and out, “with very little interruption to your learning experience,” he says.
Other features of note include: customizable color enhancement, brightness and transparency effects, drag-and-drop layering, density plots to compare multiple satellite bands, and seamless looping and re-rendering of imagery.
“The [Earth’s] atmosphere is very fluid,” says Gerth, “so making loops of things is really cool. … You can quickly see the atmospheric evolution.”
One of Gerth’s favorite features, he says, is that SIFT gives the user the ability to either probe a single point (bringing up an instant readout of that location’s latitude/longitude and temperature in Celsius) or to select a polygon of points, creating a histogram of data for that region. This feature, developed primarily by Schiffer, is not commonly found in comparable programs.
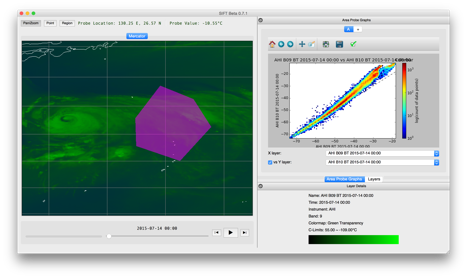
A screenshot of SIFT, showing the area-probe histogram feature. Credit: Jordan Gerth, SSEC.
Gerth says that he and the other instructors, the forecasters, and the NWS were resoundingly pleased with the results, and he hopes to use SIFT for more trainings in the future. In addition to the tireless effort and focus of individual team members — including SSEC scientists Gerth, Garcia, Hoese, Schiffer, Kathy Strabala, Scott Lindstrom, Tim Schmit, Jessica Braun, and William Straka, and UW-Madison undergraduate student Coda Phillips — Gerth attributes their success to the overall interdisciplinary nature of SSEC.
“[SIFT] is a really good example of collaborative, cross-track research in the Center,” he says. “I don’t imagine we would have been able to do this in too many organizations around the country.”
“Without people who are at the cutting edge of computer programming, “he adds, “we would not have been able to achieve the result that we did in a matter of just a few months.”
Setting up a demo system at SSEC’s booth, Gerth and others promoted SIFT at the annual American Meteorological Society (AMS) meeting in January, garnering interest from potential national and international users.
SSEC scientist Graeme Martin, project manager for CSPP Geo, has been investigating how to adapt SIFT for use with GOES direct-broadcast users, especially for the future GOES-R direct-broadcast stream, GOES Rebroadcast. Scientists who are receiving and processing satellite data, even inexperienced newcomers, could use SIFT to monitor data in real time, process and analyze data, and vet products that could be used for weather forecasting.
The intent, Garcia says, is that any GOES Rebroadcast user could open up the program and “just grab data, and manipulate it easily and rapidly.”
The team will continue to develop SIFT: adding new features and enhancing existing ones. For example, getting mass amounts of data to load more selectively, or in the background, poses a significant challenge. Making the end-to-end experience more fluid is their top priority.
“We want to make [SIFT] smart about only loading what the user cares about seeing,” Garcia says.
Garcia hopes that someday, after developing more comprehensive documentation, the team could release SIFT as a fully open-source application. This would allow other SSEC scientists and developers beyond the Center to make their own alterations and improvements.
“I’d like to turn it into wider group effort,” he says, “now that we have shown what is possible.”
by Sarah Witman